| Multiple Linear Regression - Estimated Regression Equation |
| DowJones[t] = + 4069.84036496726 + 2.69563034221495Bel20[t] -0.274651783925739Nikkei[t] + 0.0282335738045733Gold[t] + 16.2381732131674Brent[t] + e[t] |
| Multiple Linear Regression - Ordinary Least Squares | |||||
| Variable | Parameter | S.D. | T-STAT H0: parameter = 0 | 2-tail p-value | 1-tail p-value |
| (Intercept) | 4069.84036496726 | 393.520681 | 10.3421 | 0 | 0 |
| Bel20 | 2.69563034221495 | 0.217589 | 12.3887 | 0 | 0 |
| Nikkei | -0.274651783925739 | 0.057291 | -4.794 | 1.2e-05 | 6e-06 |
| Gold | 0.0282335738045733 | 0.015653 | 1.8037 | 0.076659 | 0.03833 |
| Brent | 16.2381732131674 | 2.630307 | 6.1735 | 0 | 0 |
| Multiple Linear Regression - Regression Statistics | |
| Multiple R | 0.976763607583037 |
| R-squared | 0.954067145098628 |
| Adjusted R-squared | 0.950786226891387 |
| F-TEST (value) | 290.792724729634 |
| F-TEST (DF numerator) | 4 |
| F-TEST (DF denominator) | 56 |
| p-value | 0 |
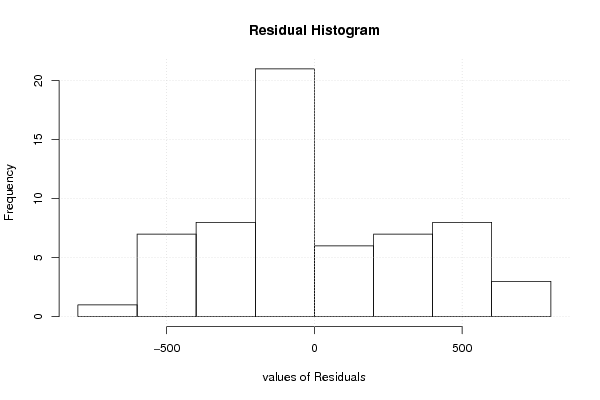
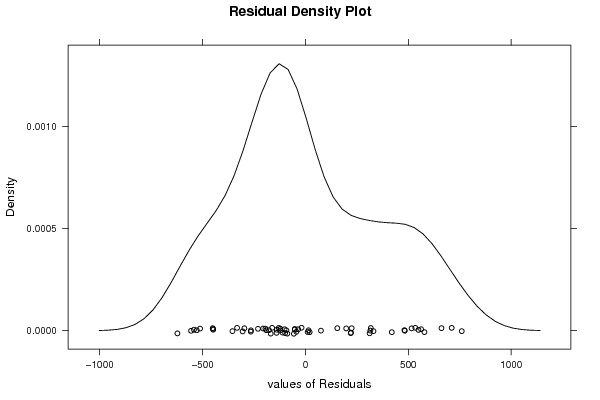
| Multiple Linear Regression - Residual Statistics | |
| Residual Standard Deviation | 363.171721297362 |
| Sum Squared Residuals | 7386047.15240499 |
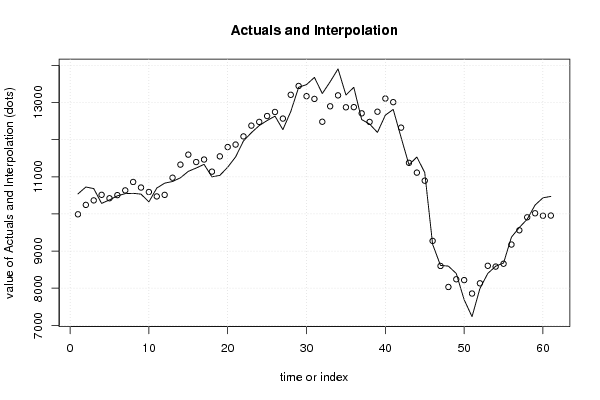
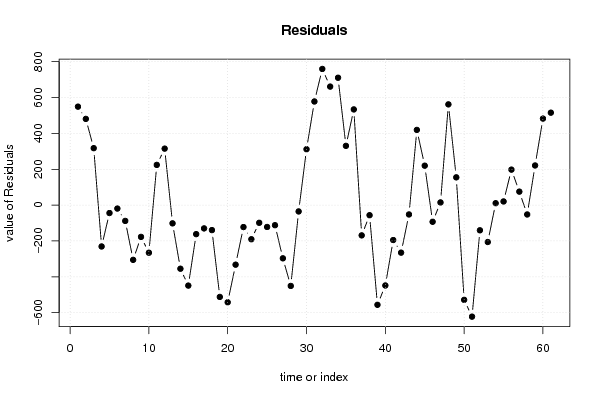
| Multiple Linear Regression - Actuals, Interpolation, and Residuals | |||
| Time or Index | Actuals | Interpolation Forecast | Residuals Prediction Error |
| 1 | 10539.51 | 9990.23377115513 | 549.276228844869 |
| 2 | 10723.78 | 10242.8235609395 | 480.95643906047 |
| 3 | 10682.06 | 10364.4212537052 | 317.638746294804 |
| 4 | 10283.19 | 10513.9339248231 | -230.743924823056 |
| 5 | 10377.18 | 10421.3633485319 | -44.183348531887 |
| 6 | 10486.64 | 10505.7642931453 | -19.1242931453103 |
| 7 | 10545.38 | 10633.5955359588 | -88.2155359587744 |
| 8 | 10554.27 | 10859.7163729885 | -305.446372988502 |
| 9 | 10532.54 | 10709.944385345 | -177.404385344999 |
| 10 | 10324.31 | 10589.9481816098 | -265.638181609795 |
| 11 | 10695.25 | 10470.9012968111 | 224.348703188928 |
| 12 | 10827.81 | 10512.6606856948 | 315.149314305154 |
| 13 | 10872.48 | 10974.2567567799 | -101.776756779903 |
| 14 | 10971.19 | 11326.0895535664 | -354.899553566401 |
| 15 | 11145.65 | 11594.6709347923 | -449.020934792262 |
| 16 | 11234.68 | 11396.6263649462 | -161.946364946236 |
| 17 | 11333.88 | 11463.8130914815 | -129.933091481513 |
| 18 | 10997.97 | 11137.3082083021 | -139.338208302055 |
| 19 | 11036.89 | 11549.1422947644 | -512.25229476441 |
| 20 | 11257.35 | 11799.400267776 | -542.050267775995 |
| 21 | 11533.59 | 11865.9479967553 | -332.357996755263 |
| 22 | 11963.12 | 12085.6491840365 | -122.529184036504 |
| 23 | 12185.15 | 12375.6222747559 | -190.472274755941 |
| 24 | 12377.62 | 12476.1886694789 | -98.5686694789479 |
| 25 | 12512.89 | 12634.8602734827 | -121.97027348271 |
| 26 | 12631.48 | 12743.5303903145 | -112.050390314507 |
| 27 | 12268.53 | 12565.4825260694 | -296.95252606942 |
| 28 | 12754.8 | 13205.7189133442 | -450.918913344152 |
| 29 | 13407.75 | 13443.1352679619 | -35.3852679619183 |
| 30 | 13480.21 | 13168.4957669491 | 311.714233050911 |
| 31 | 13673.28 | 13095.126935416 | 578.153064584028 |
| 32 | 13239.71 | 12480.0937404459 | 759.616259554148 |
| 33 | 13557.69 | 12896.5607405173 | 661.129259482686 |
| 34 | 13901.28 | 13190.7383116177 | 710.541688382298 |
| 35 | 13200.58 | 12870.0428818927 | 330.537118107277 |
| 36 | 13406.97 | 12873.1301971761 | 533.839802823855 |
| 37 | 12538.12 | 12707.0441179882 | -168.924117988204 |
| 38 | 12419.57 | 12475.9882940432 | -56.4182940432316 |
| 39 | 12193.88 | 12750.0898138545 | -556.209813854503 |
| 40 | 12656.63 | 13105.0501799657 | -448.420179965655 |
| 41 | 12812.48 | 13007.251404041 | -194.771404040964 |
| 42 | 12056.67 | 12321.8528109297 | -265.182810929696 |
| 43 | 11322.38 | 11374.5140994152 | -52.1340994151898 |
| 44 | 11530.75 | 11111.1582827359 | 419.591717264093 |
| 45 | 11114.08 | 10894.1814828565 | 219.898517143549 |
| 46 | 9181.73 | 9274.67927133985 | -92.9492713398492 |
| 47 | 8614.55 | 8599.71224491423 | 14.8377550857654 |
| 48 | 8595.56 | 8033.55088266349 | 562.009117336507 |
| 49 | 8396.2 | 8241.39499124121 | 154.805008758792 |
| 50 | 7690.5 | 8219.02808152942 | -528.52808152942 |
| 51 | 7235.47 | 7857.75792867275 | -622.287928672753 |
| 52 | 7992.12 | 8132.7162297864 | -140.596229786402 |
| 53 | 8398.37 | 8604.17118692331 | -205.801186923305 |
| 54 | 8593 | 8582.39858054148 | 10.6014194585216 |
| 55 | 8679.75 | 8659.45420347694 | 20.295796523057 |
| 56 | 9374.63 | 9176.6775245429 | 197.952475457096 |
| 57 | 9634.97 | 9559.75168518704 | 75.2183148129612 |
| 58 | 9857.34 | 9909.49054043921 | -52.1505404392132 |
| 59 | 10238.83 | 10017.7584400696 | 221.07155993036 |
| 60 | 10433.44 | 9950.74676584248 | 482.69323415752 |
| 61 | 10471.24 | 9955.5628036688 | 515.6771963312 |
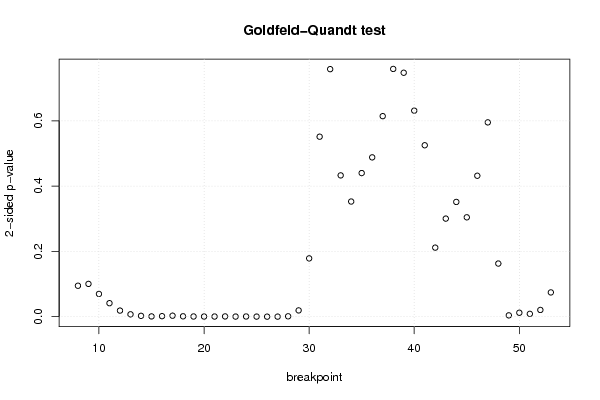
| Goldfeld-Quandt test for Heteroskedasticity | |||
| p-values | Alternative Hypothesis | ||
| breakpoint index | greater | 2-sided | less |
| 8 | 0.0474407733826318 | 0.0948815467652636 | 0.952559226617368 |
| 9 | 0.0502882496030377 | 0.100576499206075 | 0.949711750396962 |
| 10 | 0.0348755608655803 | 0.0697511217311606 | 0.96512443913442 |
| 11 | 0.0207479976967285 | 0.041495995393457 | 0.979252002303271 |
| 12 | 0.00942311430363543 | 0.0188462286072709 | 0.990576885696365 |
| 13 | 0.00374158999636156 | 0.00748317999272311 | 0.996258410003638 |
| 14 | 0.00135256373639664 | 0.00270512747279327 | 0.998647436263603 |
| 15 | 0.000510514015623986 | 0.00102102803124797 | 0.999489485984376 |
| 16 | 0.000881864835459265 | 0.00176372967091853 | 0.999118135164541 |
| 17 | 0.00157966246199986 | 0.00315932492399972 | 0.998420337538 |
| 18 | 0.00067868666296173 | 0.00135737332592346 | 0.999321313337038 |
| 19 | 0.000359213746226735 | 0.00071842749245347 | 0.999640786253773 |
| 20 | 0.000315509356129405 | 0.00063101871225881 | 0.999684490643871 |
| 21 | 0.00032312019262856 | 0.00064624038525712 | 0.999676879807371 |
| 22 | 0.000484132006415613 | 0.000968264012831225 | 0.999515867993584 |
| 23 | 0.000262200887220368 | 0.000524401774440736 | 0.99973779911278 |
| 24 | 0.00037531542862957 | 0.000750630857259141 | 0.99962468457137 |
| 25 | 0.000200296611742465 | 0.00040059322348493 | 0.999799703388258 |
| 26 | 0.000133974532124877 | 0.000267949064249754 | 0.999866025467875 |
| 27 | 0.000155547708519826 | 0.000311095417039653 | 0.99984445229148 |
| 28 | 0.000668510832437662 | 0.00133702166487532 | 0.999331489167562 |
| 29 | 0.00970251045193181 | 0.0194050209038636 | 0.990297489548068 |
| 30 | 0.0893604797670631 | 0.178720959534126 | 0.910639520232937 |
| 31 | 0.275631396419626 | 0.551262792839252 | 0.724368603580374 |
| 32 | 0.620943297554385 | 0.75811340489123 | 0.379056702445615 |
| 33 | 0.783591527452436 | 0.432816945095129 | 0.216408472547564 |
| 34 | 0.823594195696004 | 0.352811608607992 | 0.176405804303996 |
| 35 | 0.780050745932946 | 0.439898508134108 | 0.219949254067054 |
| 36 | 0.755970281688191 | 0.488059436623619 | 0.244029718311809 |
| 37 | 0.69291126789977 | 0.614177464200461 | 0.30708873210023 |
| 38 | 0.620633874988353 | 0.758732250023295 | 0.379366125011647 |
| 39 | 0.626458764493361 | 0.747082471013279 | 0.373541235506639 |
| 40 | 0.68447170647704 | 0.63105658704592 | 0.31552829352296 |
| 41 | 0.73745836874707 | 0.525083262505859 | 0.26254163125293 |
| 42 | 0.894178644580087 | 0.211642710839825 | 0.105821355419913 |
| 43 | 0.849744500080736 | 0.300510999838529 | 0.150255499919264 |
| 44 | 0.824236201521654 | 0.351527596956691 | 0.175763798478346 |
| 45 | 0.847749511809072 | 0.304500976381855 | 0.152250488190928 |
| 46 | 0.784146200726829 | 0.431707598546341 | 0.215853799273171 |
| 47 | 0.70242174014391 | 0.595156519712181 | 0.29757825985609 |
| 48 | 0.918571906702606 | 0.162856186594788 | 0.081428093297394 |
| 49 | 0.997878501305646 | 0.00424299738870789 | 0.00212149869435394 |
| 50 | 0.993885328488285 | 0.0122293430234304 | 0.00611467151171522 |
| 51 | 0.995555578761859 | 0.00888884247628161 | 0.00444442123814081 |
| 52 | 0.989587865556953 | 0.0208242688860944 | 0.0104121344430472 |
| 53 | 0.962754488058964 | 0.0744910238820719 | 0.037245511941036 |
| Meta Analysis of Goldfeld-Quandt test for Heteroskedasticity | |||
| Description | # significant tests | % significant tests | OK/NOK |
| 1% type I error level | 18 | 0.391304347826087 | NOK |
| 5% type I error level | 23 | 0.5 | NOK |
| 10% type I error level | 26 | 0.565217391304348 | NOK |