Free Statistics

of Irreproducible Research!

Author's title

Author*The author of this computation has been verified*
R Software Modulerwasp_exponentialsmoothing.wasp
Title produced by softwareExponential Smoothing
Date of computationThu, 24 Nov 2011 10:15:41 -0500
Cite this page as followsStatistical Computations at FreeStatistics.org, Office for Research Development and Education, URL https://freestatistics.org/blog/index.php?v=date/2011/Nov/24/t132214775697ubmv0vii6yqk6.htm/, Retrieved Fri, 19 Apr 2024 01:19:42 +0000
Statistical Computations at FreeStatistics.org, Office for Research Development and Education, URL https://freestatistics.org/blog/index.php?pk=146950, Retrieved Fri, 19 Apr 2024 01:19:42 +0000
QR Codes:

Original text written by user:
IsPrivate?No (this computation is public)
User-defined keywords
Estimated Impact66
Family? (F = Feedback message, R = changed R code, M = changed R Module, P = changed Parameters, D = changed Data)
F     [Univariate Data Series] [HPC Retail Sales] [2008-03-02 15:42:48] [74be16979710d4c4e7c6647856088456]
- RMPD  [Univariate Data Series] [] [2011-11-24 14:29:18] [86f7284edee3dbb8ea5c7e2dec87d892]
- RMPD      [Exponential Smoothing] [] [2011-11-24 15:15:41] [79818163420d1233b8d9d93d595e6c9e] [Current]
Feedback Forum

Post a new message
Dataseries X:
579
572
560
551
537
541
588
607
599
578
563
566
561
554
540
526
512
505
554
584
569
540
522
526
527
516
503
489
479
475
524
552
532
511
492
492
493
481
462
457
442
439
488
521
501
485
464
460
467
460
448
443
436
431
484
510
513
503
471
471


Summary of computational transaction
Raw Inputview raw input (R code)
Raw Outputview raw output of R engine
Computing time1 seconds
R Server'Gertrude Mary Cox' @ cox.wessa.net

\begin{tabular}{lllllllll}
\hline
Summary of computational transaction \tabularnewline
Raw Input & view raw input (R code)  \tabularnewline
Raw Output & view raw output of R engine  \tabularnewline
Computing time & 1 seconds \tabularnewline
R Server & 'Gertrude Mary Cox' @ cox.wessa.net \tabularnewline
\hline
\end{tabular}
%Source: https://freestatistics.org/blog/index.php?pk=146950&T=0

[TABLE]
[ROW][C]Summary of computational transaction[/C][/ROW]
[ROW][C]Raw Input[/C][C]view raw input (R code) [/C][/ROW]
[ROW][C]Raw Output[/C][C]view raw output of R engine [/C][/ROW]
[ROW][C]Computing time[/C][C]1 seconds[/C][/ROW]
[ROW][C]R Server[/C][C]'Gertrude Mary Cox' @ cox.wessa.net[/C][/ROW]
[/TABLE]
Source: https://freestatistics.org/blog/index.php?pk=146950&T=0

Globally Unique Identifier (entire table): ba.freestatistics.org/blog/index.php?pk=146950&T=0

As an alternative you can also use a QR Code:  

The GUIDs for individual cells are displayed in the table below:

Summary of computational transaction
Raw Inputview raw input (R code)
Raw Outputview raw output of R engine
Computing time1 seconds
R Server'Gertrude Mary Cox' @ cox.wessa.net


Estimated Parameters of Exponential Smoothing
ParameterValue
alpha0.223071063075747
beta0.704071621970474
gamma0.798808592252794

\begin{tabular}{lllllllll}
\hline
Estimated Parameters of Exponential Smoothing \tabularnewline
Parameter & Value \tabularnewline
alpha & 0.223071063075747 \tabularnewline
beta & 0.704071621970474 \tabularnewline
gamma & 0.798808592252794 \tabularnewline
\hline
\end{tabular}
%Source: https://freestatistics.org/blog/index.php?pk=146950&T=1

[TABLE]
[ROW][C]Estimated Parameters of Exponential Smoothing[/C][/ROW]
[ROW][C]Parameter[/C][C]Value[/C][/ROW]
[ROW][C]alpha[/C][C]0.223071063075747[/C][/ROW]
[ROW][C]beta[/C][C]0.704071621970474[/C][/ROW]
[ROW][C]gamma[/C][C]0.798808592252794[/C][/ROW]
[/TABLE]
Source: https://freestatistics.org/blog/index.php?pk=146950&T=1

Globally Unique Identifier (entire table): ba.freestatistics.org/blog/index.php?pk=146950&T=1

As an alternative you can also use a QR Code:  

The GUIDs for individual cells are displayed in the table below:

Estimated Parameters of Exponential Smoothing
ParameterValue
alpha0.223071063075747
beta0.704071621970474
gamma0.798808592252794


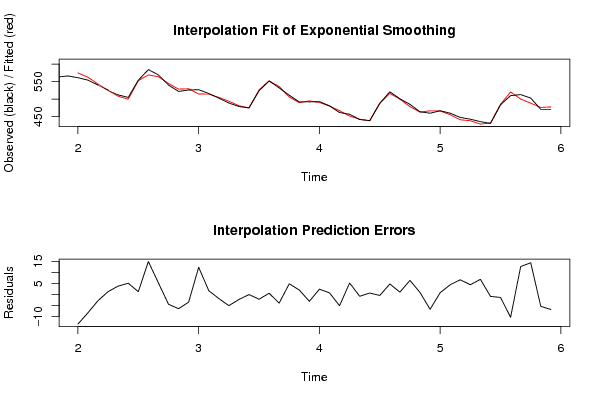
Interpolation Forecasts of Exponential Smoothing
tObservedFittedResiduals
13561574.514957264957-13.514957264957
14554562.330617730206-8.33061773020643
15540542.827697457408-2.82769745740802
16526524.733206937931.26679306206984
17512508.2093720960423.79062790395812
18505499.9272135657255.07278643427549
19554552.7694558866081.23054411339206
20584569.03120526546414.9687947345365
21569563.7918631896835.20813681031655
22540544.484847019303-4.4848470193034
23522528.519558848554-6.51955884855352
24526529.534769772832-3.53476977283185
25527514.64801774920912.3519822507906
26516514.308562439941.69143756005997
27503504.887752020474-1.88775202047384
28489494.122945242633-5.12294524263331
29479481.315417829978-2.31541782997766
30475475.083240908452-0.0832409084518417
31524526.197298182932-2.19729818293195
32552551.4887622787160.511237721283692
33532535.964215549864-3.96421554986432
34511506.1523793104244.84762068957605
35492490.0287574200621.97124257993761
36492495.146621722687-3.14662172268697
37493490.6232014568492.37679854315058
38481480.2929188242680.707081175732185
39462467.12708641895-5.12708641895006
40457451.8189640771635.18103592283717
41442442.857783864721-0.857783864720602
42439438.3704505626030.629549437397429
43488488.47779878205-0.477798782049945
44521516.2501683999134.7498316000873
45501499.9756598991051.0243401008949
46485478.610973792586.38902620741993
47464463.153722176060.846277823939715
48460466.775376399843-6.77537639984297
49467466.2314655409750.768534459025147
50460455.6146273811994.38537261880145
51448441.3346913945526.66530860544788
52443438.592765014514.40723498549022
53436429.127895913456.87210408654994
54431431.918703818457-0.918703818457175
55484485.381038068533-1.38103806853343
56510520.44201535638-10.4420153563802
57513500.32627423237612.6737257676241
58503488.57901046734814.420989532652
59471476.424378244796-5.42437824479566
60471477.883089249217-6.88308924921665

\begin{tabular}{lllllllll}
\hline
Interpolation Forecasts of Exponential Smoothing \tabularnewline
t & Observed & Fitted & Residuals \tabularnewline
13 & 561 & 574.514957264957 & -13.514957264957 \tabularnewline
14 & 554 & 562.330617730206 & -8.33061773020643 \tabularnewline
15 & 540 & 542.827697457408 & -2.82769745740802 \tabularnewline
16 & 526 & 524.73320693793 & 1.26679306206984 \tabularnewline
17 & 512 & 508.209372096042 & 3.79062790395812 \tabularnewline
18 & 505 & 499.927213565725 & 5.07278643427549 \tabularnewline
19 & 554 & 552.769455886608 & 1.23054411339206 \tabularnewline
20 & 584 & 569.031205265464 & 14.9687947345365 \tabularnewline
21 & 569 & 563.791863189683 & 5.20813681031655 \tabularnewline
22 & 540 & 544.484847019303 & -4.4848470193034 \tabularnewline
23 & 522 & 528.519558848554 & -6.51955884855352 \tabularnewline
24 & 526 & 529.534769772832 & -3.53476977283185 \tabularnewline
25 & 527 & 514.648017749209 & 12.3519822507906 \tabularnewline
26 & 516 & 514.30856243994 & 1.69143756005997 \tabularnewline
27 & 503 & 504.887752020474 & -1.88775202047384 \tabularnewline
28 & 489 & 494.122945242633 & -5.12294524263331 \tabularnewline
29 & 479 & 481.315417829978 & -2.31541782997766 \tabularnewline
30 & 475 & 475.083240908452 & -0.0832409084518417 \tabularnewline
31 & 524 & 526.197298182932 & -2.19729818293195 \tabularnewline
32 & 552 & 551.488762278716 & 0.511237721283692 \tabularnewline
33 & 532 & 535.964215549864 & -3.96421554986432 \tabularnewline
34 & 511 & 506.152379310424 & 4.84762068957605 \tabularnewline
35 & 492 & 490.028757420062 & 1.97124257993761 \tabularnewline
36 & 492 & 495.146621722687 & -3.14662172268697 \tabularnewline
37 & 493 & 490.623201456849 & 2.37679854315058 \tabularnewline
38 & 481 & 480.292918824268 & 0.707081175732185 \tabularnewline
39 & 462 & 467.12708641895 & -5.12708641895006 \tabularnewline
40 & 457 & 451.818964077163 & 5.18103592283717 \tabularnewline
41 & 442 & 442.857783864721 & -0.857783864720602 \tabularnewline
42 & 439 & 438.370450562603 & 0.629549437397429 \tabularnewline
43 & 488 & 488.47779878205 & -0.477798782049945 \tabularnewline
44 & 521 & 516.250168399913 & 4.7498316000873 \tabularnewline
45 & 501 & 499.975659899105 & 1.0243401008949 \tabularnewline
46 & 485 & 478.61097379258 & 6.38902620741993 \tabularnewline
47 & 464 & 463.15372217606 & 0.846277823939715 \tabularnewline
48 & 460 & 466.775376399843 & -6.77537639984297 \tabularnewline
49 & 467 & 466.231465540975 & 0.768534459025147 \tabularnewline
50 & 460 & 455.614627381199 & 4.38537261880145 \tabularnewline
51 & 448 & 441.334691394552 & 6.66530860544788 \tabularnewline
52 & 443 & 438.59276501451 & 4.40723498549022 \tabularnewline
53 & 436 & 429.12789591345 & 6.87210408654994 \tabularnewline
54 & 431 & 431.918703818457 & -0.918703818457175 \tabularnewline
55 & 484 & 485.381038068533 & -1.38103806853343 \tabularnewline
56 & 510 & 520.44201535638 & -10.4420153563802 \tabularnewline
57 & 513 & 500.326274232376 & 12.6737257676241 \tabularnewline
58 & 503 & 488.579010467348 & 14.420989532652 \tabularnewline
59 & 471 & 476.424378244796 & -5.42437824479566 \tabularnewline
60 & 471 & 477.883089249217 & -6.88308924921665 \tabularnewline
\hline
\end{tabular}
%Source: https://freestatistics.org/blog/index.php?pk=146950&T=2

[TABLE]
[ROW][C]Interpolation Forecasts of Exponential Smoothing[/C][/ROW]
[ROW][C]t[/C][C]Observed[/C][C]Fitted[/C][C]Residuals[/C][/ROW]
[ROW][C]13[/C][C]561[/C][C]574.514957264957[/C][C]-13.514957264957[/C][/ROW]
[ROW][C]14[/C][C]554[/C][C]562.330617730206[/C][C]-8.33061773020643[/C][/ROW]
[ROW][C]15[/C][C]540[/C][C]542.827697457408[/C][C]-2.82769745740802[/C][/ROW]
[ROW][C]16[/C][C]526[/C][C]524.73320693793[/C][C]1.26679306206984[/C][/ROW]
[ROW][C]17[/C][C]512[/C][C]508.209372096042[/C][C]3.79062790395812[/C][/ROW]
[ROW][C]18[/C][C]505[/C][C]499.927213565725[/C][C]5.07278643427549[/C][/ROW]
[ROW][C]19[/C][C]554[/C][C]552.769455886608[/C][C]1.23054411339206[/C][/ROW]
[ROW][C]20[/C][C]584[/C][C]569.031205265464[/C][C]14.9687947345365[/C][/ROW]
[ROW][C]21[/C][C]569[/C][C]563.791863189683[/C][C]5.20813681031655[/C][/ROW]
[ROW][C]22[/C][C]540[/C][C]544.484847019303[/C][C]-4.4848470193034[/C][/ROW]
[ROW][C]23[/C][C]522[/C][C]528.519558848554[/C][C]-6.51955884855352[/C][/ROW]
[ROW][C]24[/C][C]526[/C][C]529.534769772832[/C][C]-3.53476977283185[/C][/ROW]
[ROW][C]25[/C][C]527[/C][C]514.648017749209[/C][C]12.3519822507906[/C][/ROW]
[ROW][C]26[/C][C]516[/C][C]514.30856243994[/C][C]1.69143756005997[/C][/ROW]
[ROW][C]27[/C][C]503[/C][C]504.887752020474[/C][C]-1.88775202047384[/C][/ROW]
[ROW][C]28[/C][C]489[/C][C]494.122945242633[/C][C]-5.12294524263331[/C][/ROW]
[ROW][C]29[/C][C]479[/C][C]481.315417829978[/C][C]-2.31541782997766[/C][/ROW]
[ROW][C]30[/C][C]475[/C][C]475.083240908452[/C][C]-0.0832409084518417[/C][/ROW]
[ROW][C]31[/C][C]524[/C][C]526.197298182932[/C][C]-2.19729818293195[/C][/ROW]
[ROW][C]32[/C][C]552[/C][C]551.488762278716[/C][C]0.511237721283692[/C][/ROW]
[ROW][C]33[/C][C]532[/C][C]535.964215549864[/C][C]-3.96421554986432[/C][/ROW]
[ROW][C]34[/C][C]511[/C][C]506.152379310424[/C][C]4.84762068957605[/C][/ROW]
[ROW][C]35[/C][C]492[/C][C]490.028757420062[/C][C]1.97124257993761[/C][/ROW]
[ROW][C]36[/C][C]492[/C][C]495.146621722687[/C][C]-3.14662172268697[/C][/ROW]
[ROW][C]37[/C][C]493[/C][C]490.623201456849[/C][C]2.37679854315058[/C][/ROW]
[ROW][C]38[/C][C]481[/C][C]480.292918824268[/C][C]0.707081175732185[/C][/ROW]
[ROW][C]39[/C][C]462[/C][C]467.12708641895[/C][C]-5.12708641895006[/C][/ROW]
[ROW][C]40[/C][C]457[/C][C]451.818964077163[/C][C]5.18103592283717[/C][/ROW]
[ROW][C]41[/C][C]442[/C][C]442.857783864721[/C][C]-0.857783864720602[/C][/ROW]
[ROW][C]42[/C][C]439[/C][C]438.370450562603[/C][C]0.629549437397429[/C][/ROW]
[ROW][C]43[/C][C]488[/C][C]488.47779878205[/C][C]-0.477798782049945[/C][/ROW]
[ROW][C]44[/C][C]521[/C][C]516.250168399913[/C][C]4.7498316000873[/C][/ROW]
[ROW][C]45[/C][C]501[/C][C]499.975659899105[/C][C]1.0243401008949[/C][/ROW]
[ROW][C]46[/C][C]485[/C][C]478.61097379258[/C][C]6.38902620741993[/C][/ROW]
[ROW][C]47[/C][C]464[/C][C]463.15372217606[/C][C]0.846277823939715[/C][/ROW]
[ROW][C]48[/C][C]460[/C][C]466.775376399843[/C][C]-6.77537639984297[/C][/ROW]
[ROW][C]49[/C][C]467[/C][C]466.231465540975[/C][C]0.768534459025147[/C][/ROW]
[ROW][C]50[/C][C]460[/C][C]455.614627381199[/C][C]4.38537261880145[/C][/ROW]
[ROW][C]51[/C][C]448[/C][C]441.334691394552[/C][C]6.66530860544788[/C][/ROW]
[ROW][C]52[/C][C]443[/C][C]438.59276501451[/C][C]4.40723498549022[/C][/ROW]
[ROW][C]53[/C][C]436[/C][C]429.12789591345[/C][C]6.87210408654994[/C][/ROW]
[ROW][C]54[/C][C]431[/C][C]431.918703818457[/C][C]-0.918703818457175[/C][/ROW]
[ROW][C]55[/C][C]484[/C][C]485.381038068533[/C][C]-1.38103806853343[/C][/ROW]
[ROW][C]56[/C][C]510[/C][C]520.44201535638[/C][C]-10.4420153563802[/C][/ROW]
[ROW][C]57[/C][C]513[/C][C]500.326274232376[/C][C]12.6737257676241[/C][/ROW]
[ROW][C]58[/C][C]503[/C][C]488.579010467348[/C][C]14.420989532652[/C][/ROW]
[ROW][C]59[/C][C]471[/C][C]476.424378244796[/C][C]-5.42437824479566[/C][/ROW]
[ROW][C]60[/C][C]471[/C][C]477.883089249217[/C][C]-6.88308924921665[/C][/ROW]
[/TABLE]
Source: https://freestatistics.org/blog/index.php?pk=146950&T=2

Globally Unique Identifier (entire table): ba.freestatistics.org/blog/index.php?pk=146950&T=2

As an alternative you can also use a QR Code:  

The GUIDs for individual cells are displayed in the table below:

Interpolation Forecasts of Exponential Smoothing
tObservedFittedResiduals
13561574.514957264957-13.514957264957
14554562.330617730206-8.33061773020643
15540542.827697457408-2.82769745740802
16526524.733206937931.26679306206984
17512508.2093720960423.79062790395812
18505499.9272135657255.07278643427549
19554552.7694558866081.23054411339206
20584569.03120526546414.9687947345365
21569563.7918631896835.20813681031655
22540544.484847019303-4.4848470193034
23522528.519558848554-6.51955884855352
24526529.534769772832-3.53476977283185
25527514.64801774920912.3519822507906
26516514.308562439941.69143756005997
27503504.887752020474-1.88775202047384
28489494.122945242633-5.12294524263331
29479481.315417829978-2.31541782997766
30475475.083240908452-0.0832409084518417
31524526.197298182932-2.19729818293195
32552551.4887622787160.511237721283692
33532535.964215549864-3.96421554986432
34511506.1523793104244.84762068957605
35492490.0287574200621.97124257993761
36492495.146621722687-3.14662172268697
37493490.6232014568492.37679854315058
38481480.2929188242680.707081175732185
39462467.12708641895-5.12708641895006
40457451.8189640771635.18103592283717
41442442.857783864721-0.857783864720602
42439438.3704505626030.629549437397429
43488488.47779878205-0.477798782049945
44521516.2501683999134.7498316000873
45501499.9756598991051.0243401008949
46485478.610973792586.38902620741993
47464463.153722176060.846277823939715
48460466.775376399843-6.77537639984297
49467466.2314655409750.768534459025147
50460455.6146273811994.38537261880145
51448441.3346913945526.66530860544788
52443438.592765014514.40723498549022
53436429.127895913456.87210408654994
54431431.918703818457-0.918703818457175
55484485.381038068533-1.38103806853343
56510520.44201535638-10.4420153563802
57513500.32627423237612.6737257676241
58503488.57901046734814.420989532652
59471476.424378244796-5.42437824479566
60471477.883089249217-6.88308924921665


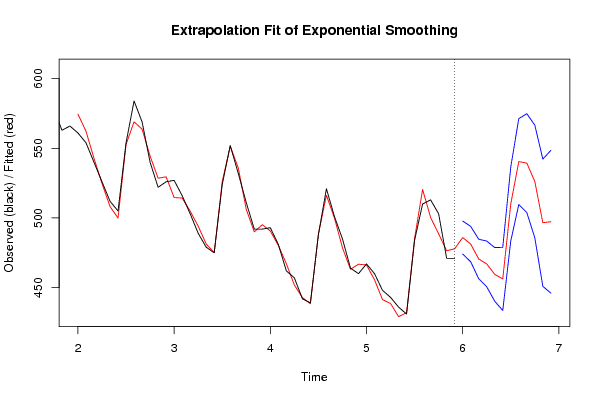
Extrapolation Forecasts of Exponential Smoothing
tForecast95% Lower Bound95% Upper Bound
61485.946107546524474.086771467962497.805443625086
62481.230873793286468.543611565011493.918136021562
63470.527267506045456.330358951009484.724176061081
64466.989874783392450.578317694522483.401431872261
65459.472199640592440.203930689377478.740468591808
66456.216188843005433.538628474894478.893749211116
67510.062077055812483.504696564808536.619457546815
68540.490176348401509.64746382009571.332888876712
69539.372236040447503.88779294529574.856679135605
70526.214158838465485.768498992246566.659818684685
71496.593252113943450.895018047234542.291486180652
72497.275639080963446.055370867333548.495907294594

\begin{tabular}{lllllllll}
\hline
Extrapolation Forecasts of Exponential Smoothing \tabularnewline
t & Forecast & 95% Lower Bound & 95% Upper Bound \tabularnewline
61 & 485.946107546524 & 474.086771467962 & 497.805443625086 \tabularnewline
62 & 481.230873793286 & 468.543611565011 & 493.918136021562 \tabularnewline
63 & 470.527267506045 & 456.330358951009 & 484.724176061081 \tabularnewline
64 & 466.989874783392 & 450.578317694522 & 483.401431872261 \tabularnewline
65 & 459.472199640592 & 440.203930689377 & 478.740468591808 \tabularnewline
66 & 456.216188843005 & 433.538628474894 & 478.893749211116 \tabularnewline
67 & 510.062077055812 & 483.504696564808 & 536.619457546815 \tabularnewline
68 & 540.490176348401 & 509.64746382009 & 571.332888876712 \tabularnewline
69 & 539.372236040447 & 503.88779294529 & 574.856679135605 \tabularnewline
70 & 526.214158838465 & 485.768498992246 & 566.659818684685 \tabularnewline
71 & 496.593252113943 & 450.895018047234 & 542.291486180652 \tabularnewline
72 & 497.275639080963 & 446.055370867333 & 548.495907294594 \tabularnewline
\hline
\end{tabular}
%Source: https://freestatistics.org/blog/index.php?pk=146950&T=3

[TABLE]
[ROW][C]Extrapolation Forecasts of Exponential Smoothing[/C][/ROW]
[ROW][C]t[/C][C]Forecast[/C][C]95% Lower Bound[/C][C]95% Upper Bound[/C][/ROW]
[ROW][C]61[/C][C]485.946107546524[/C][C]474.086771467962[/C][C]497.805443625086[/C][/ROW]
[ROW][C]62[/C][C]481.230873793286[/C][C]468.543611565011[/C][C]493.918136021562[/C][/ROW]
[ROW][C]63[/C][C]470.527267506045[/C][C]456.330358951009[/C][C]484.724176061081[/C][/ROW]
[ROW][C]64[/C][C]466.989874783392[/C][C]450.578317694522[/C][C]483.401431872261[/C][/ROW]
[ROW][C]65[/C][C]459.472199640592[/C][C]440.203930689377[/C][C]478.740468591808[/C][/ROW]
[ROW][C]66[/C][C]456.216188843005[/C][C]433.538628474894[/C][C]478.893749211116[/C][/ROW]
[ROW][C]67[/C][C]510.062077055812[/C][C]483.504696564808[/C][C]536.619457546815[/C][/ROW]
[ROW][C]68[/C][C]540.490176348401[/C][C]509.64746382009[/C][C]571.332888876712[/C][/ROW]
[ROW][C]69[/C][C]539.372236040447[/C][C]503.88779294529[/C][C]574.856679135605[/C][/ROW]
[ROW][C]70[/C][C]526.214158838465[/C][C]485.768498992246[/C][C]566.659818684685[/C][/ROW]
[ROW][C]71[/C][C]496.593252113943[/C][C]450.895018047234[/C][C]542.291486180652[/C][/ROW]
[ROW][C]72[/C][C]497.275639080963[/C][C]446.055370867333[/C][C]548.495907294594[/C][/ROW]
[/TABLE]
Source: https://freestatistics.org/blog/index.php?pk=146950&T=3

Globally Unique Identifier (entire table): ba.freestatistics.org/blog/index.php?pk=146950&T=3

As an alternative you can also use a QR Code:  

The GUIDs for individual cells are displayed in the table below:

Extrapolation Forecasts of Exponential Smoothing
tForecast95% Lower Bound95% Upper Bound
61485.946107546524474.086771467962497.805443625086
62481.230873793286468.543611565011493.918136021562
63470.527267506045456.330358951009484.724176061081
64466.989874783392450.578317694522483.401431872261
65459.472199640592440.203930689377478.740468591808
66456.216188843005433.538628474894478.893749211116
67510.062077055812483.504696564808536.619457546815
68540.490176348401509.64746382009571.332888876712
69539.372236040447503.88779294529574.856679135605
70526.214158838465485.768498992246566.659818684685
71496.593252113943450.895018047234542.291486180652
72497.275639080963446.055370867333548.495907294594


Parameters (Session):
par1 = 12 ; par2 = Triple ; par3 = additive ;
Parameters (R input):
par1 = 12 ; par2 = Triple ; par3 = additive ;
R code (references can be found in the software module):
par1 <- as.numeric(par1)
if (par2 == 'Single') K <- 1
if (par2 == 'Double') K <- 2
if (par2 == 'Triple') K <- par1
nx <- length(x)
nxmK <- nx - K
x <- ts(x, frequency = par1)
if (par2 == 'Single') fit <- HoltWinters(x, gamma=F, beta=F)
if (par2 == 'Double') fit <- HoltWinters(x, gamma=F)
if (par2 == 'Triple') fit <- HoltWinters(x, seasonal=par3)
fit
myresid <- x - fit$fitted[,'xhat']
bitmap(file='test1.png')
op <- par(mfrow=c(2,1))
plot(fit,ylab='Observed (black) / Fitted (red)',main='Interpolation Fit of Exponential Smoothing')
plot(myresid,ylab='Residuals',main='Interpolation Prediction Errors')
par(op)
dev.off()
bitmap(file='test2.png')
p <- predict(fit, par1, prediction.interval=TRUE)
np <- length(p[,1])
plot(fit,p,ylab='Observed (black) / Fitted (red)',main='Extrapolation Fit of Exponential Smoothing')
dev.off()
bitmap(file='test3.png')
op <- par(mfrow = c(2,2))
acf(as.numeric(myresid),lag.max = nx/2,main='Residual ACF')
spectrum(myresid,main='Residals Periodogram')
cpgram(myresid,main='Residal Cumulative Periodogram')
qqnorm(myresid,main='Residual Normal QQ Plot')
qqline(myresid)
par(op)
dev.off()
load(file='createtable')
a<-table.start()
a<-table.row.start(a)
a<-table.element(a,'Estimated Parameters of Exponential Smoothing',2,TRUE)
a<-table.row.end(a)
a<-table.row.start(a)
a<-table.element(a,'Parameter',header=TRUE)
a<-table.element(a,'Value',header=TRUE)
a<-table.row.end(a)
a<-table.row.start(a)
a<-table.element(a,'alpha',header=TRUE)
a<-table.element(a,fit$alpha)
a<-table.row.end(a)
a<-table.row.start(a)
a<-table.element(a,'beta',header=TRUE)
a<-table.element(a,fit$beta)
a<-table.row.end(a)
a<-table.row.start(a)
a<-table.element(a,'gamma',header=TRUE)
a<-table.element(a,fit$gamma)
a<-table.row.end(a)
a<-table.end(a)
table.save(a,file='mytable.tab')
a<-table.start()
a<-table.row.start(a)
a<-table.element(a,'Interpolation Forecasts of Exponential Smoothing',4,TRUE)
a<-table.row.end(a)
a<-table.row.start(a)
a<-table.element(a,'t',header=TRUE)
a<-table.element(a,'Observed',header=TRUE)
a<-table.element(a,'Fitted',header=TRUE)
a<-table.element(a,'Residuals',header=TRUE)
a<-table.row.end(a)
for (i in 1:nxmK) {
a<-table.row.start(a)
a<-table.element(a,i+K,header=TRUE)
a<-table.element(a,x[i+K])
a<-table.element(a,fit$fitted[i,'xhat'])
a<-table.element(a,myresid[i])
a<-table.row.end(a)
}
a<-table.end(a)
table.save(a,file='mytable1.tab')
a<-table.start()
a<-table.row.start(a)
a<-table.element(a,'Extrapolation Forecasts of Exponential Smoothing',4,TRUE)
a<-table.row.end(a)
a<-table.row.start(a)
a<-table.element(a,'t',header=TRUE)
a<-table.element(a,'Forecast',header=TRUE)
a<-table.element(a,'95% Lower Bound',header=TRUE)
a<-table.element(a,'95% Upper Bound',header=TRUE)
a<-table.row.end(a)
for (i in 1:np) {
a<-table.row.start(a)
a<-table.element(a,nx+i,header=TRUE)
a<-table.element(a,p[i,'fit'])
a<-table.element(a,p[i,'lwr'])
a<-table.element(a,p[i,'upr'])
a<-table.row.end(a)
}
a<-table.end(a)
table.save(a,file='mytable2.tab')