| Multiple Linear Regression - Estimated Regression Equation |
| ranking[t] = + 56.0010234656397 + 2.64925503775987e-05pages[t] -0.613511444631174blogs[t] + 0.179461096070821pr[t] -0.355845436769928lfm[t] + e[t] |
| Multiple Linear Regression - Ordinary Least Squares | |||||
| Variable | Parameter | S.D. | T-STAT H0: parameter = 0 | 2-tail p-value | 1-tail p-value |
| (Intercept) | 56.0010234656397 | 7.355163 | 7.6138 | 0 | 0 |
| pages | 2.64925503775987e-05 | 1.4e-05 | 1.8456 | 0.070342 | 0.035171 |
| blogs | -0.613511444631174 | 0.155514 | -3.9451 | 0.000228 | 0.000114 |
| pr | 0.179461096070821 | 1.226283 | 0.1463 | 0.884184 | 0.442092 |
| lfm | -0.355845436769928 | 0.318706 | -1.1165 | 0.269049 | 0.134524 |
| Multiple Linear Regression - Regression Statistics | |
| Multiple R | 0.609804774362215 |
| R-squared | 0.371861862834952 |
| Adjusted R-squared | 0.326179089222948 |
| F-TEST (value) | 8.14008943487709 |
| F-TEST (DF numerator) | 4 |
| F-TEST (DF denominator) | 55 |
| p-value | 3.13869982985215e-05 |
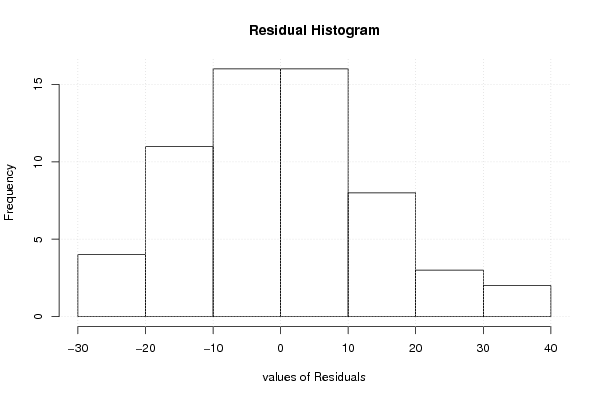
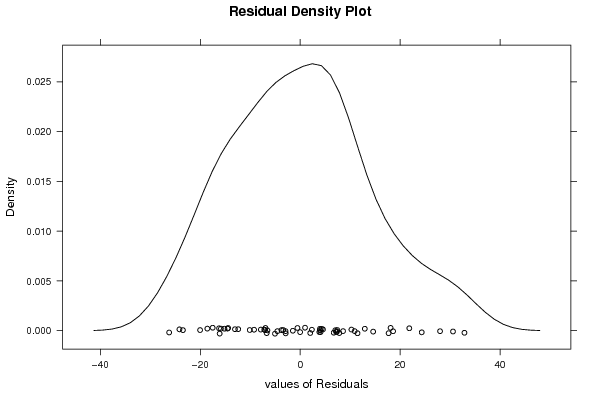
| Multiple Linear Regression - Residual Statistics | |
| Residual Standard Deviation | 14.3358075387123 |
| Sum Squared Residuals | 11303.345778285 |
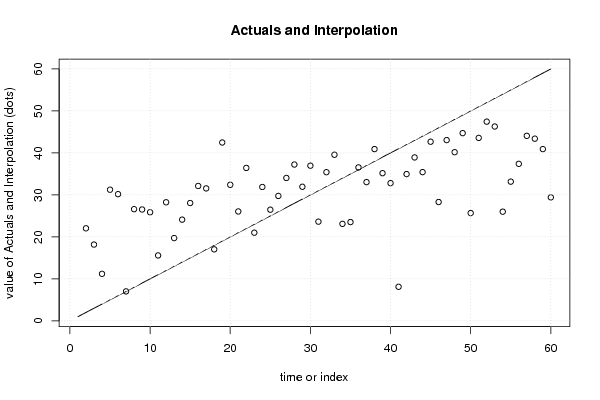
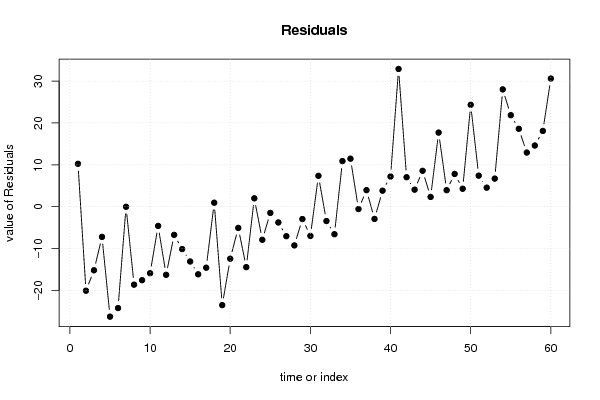
| Multiple Linear Regression - Actuals, Interpolation, and Residuals | |||
| Time or Index | Actuals | Interpolation Forecast | Residuals Prediction Error |
| 1 | 1 | -9.24507907255771 | 10.2450790725577 |
| 2 | 2 | 22.0452103418778 | -20.0452103418778 |
| 3 | 3 | 18.1691919439491 | -15.1691919439491 |
| 4 | 4 | 11.2013271395625 | -7.20132713956255 |
| 5 | 5 | 31.2332687056596 | -26.2332687056596 |
| 6 | 6 | 30.1795539388359 | -24.1795539388359 |
| 7 | 7 | 7.01472066312939 | -0.0147206631293924 |
| 8 | 8 | 26.5983489381454 | -18.5983489381454 |
| 9 | 9 | 26.5247924419327 | -17.5247924419327 |
| 10 | 10 | 25.8705296610425 | -15.8705296610425 |
| 11 | 11 | 15.5787927457081 | -4.57879274570814 |
| 12 | 12 | 28.2465466562335 | -16.2465466562335 |
| 13 | 13 | 19.7139749359698 | -6.71397493596976 |
| 14 | 14 | 24.1058501582709 | -10.1058501582709 |
| 15 | 15 | 28.0671360226598 | -13.0671360226598 |
| 16 | 16 | 32.1246985919918 | -16.1246985919918 |
| 17 | 17 | 31.5502817180405 | -14.5502817180405 |
| 18 | 18 | 17.0346509512287 | 0.965349048771309 |
| 19 | 19 | 42.4811728585775 | -23.4811728585775 |
| 20 | 20 | 32.4044359086291 | -12.4044359086291 |
| 21 | 21 | 26.0531828543764 | -5.05318285437643 |
| 22 | 22 | 36.4194555780803 | -14.4194555780803 |
| 23 | 23 | 20.9939024715571 | 2.00609752844289 |
| 24 | 24 | 31.8863950614823 | -7.88639506148233 |
| 25 | 25 | 26.4749317074336 | -1.47493170743362 |
| 26 | 26 | 29.7541281058974 | -3.75412810589743 |
| 27 | 27 | 34.0359789457635 | -7.03597894576349 |
| 28 | 28 | 37.2305093805606 | -9.23050938056058 |
| 29 | 29 | 31.9374805043698 | -2.93748050436975 |
| 30 | 30 | 36.9557736192832 | -6.95577361928323 |
| 31 | 31 | 23.6270769735014 | 7.37292302649861 |
| 32 | 32 | 35.4086307245992 | -3.40863072459919 |
| 33 | 33 | 39.5627369211911 | -6.56273692119109 |
| 34 | 34 | 23.1039764983867 | 10.8960235016133 |
| 35 | 35 | 23.5292271092004 | 11.4707728907996 |
| 36 | 36 | 36.5493924268965 | -0.549392426896518 |
| 37 | 37 | 33.0432588325534 | 3.95674116744663 |
| 38 | 38 | 40.9115093134298 | -2.91150931342982 |
| 39 | 39 | 35.1698133793546 | 3.8301866206454 |
| 40 | 40 | 32.7986794468566 | 7.20132055314339 |
| 41 | 41 | 8.11623633345107 | 32.8837636665489 |
| 42 | 42 | 34.9601395135187 | 7.03986048648128 |
| 43 | 43 | 38.9273006957222 | 4.07269930427783 |
| 44 | 44 | 35.4237946311675 | 8.57620536883251 |
| 45 | 45 | 42.6635909329402 | 2.3364090670598 |
| 46 | 46 | 28.3053511018797 | 17.6946488981203 |
| 47 | 47 | 43.0519213518735 | 3.94807864812645 |
| 48 | 48 | 40.171286057981 | 7.82871394201904 |
| 49 | 49 | 44.70850585529 | 4.29149414470996 |
| 50 | 50 | 25.6724046101858 | 24.3275953898142 |
| 51 | 51 | 43.5798841719946 | 7.42011582800543 |
| 52 | 52 | 47.4453972452805 | 4.55460275471954 |
| 53 | 53 | 46.2889050702326 | 6.71109492976741 |
| 54 | 54 | 26.0012482270472 | 27.9987517729528 |
| 55 | 55 | 33.1571187220205 | 21.8428812779795 |
| 56 | 56 | 37.4011765612399 | 18.5988234387601 |
| 57 | 57 | 44.0689608756712 | 12.9310391243288 |
| 58 | 58 | 43.3908207194817 | 14.6091792805183 |
| 59 | 59 | 40.9109581605219 | 18.0890418394781 |
| 60 | 60 | 29.4095540588392 | 30.5904459411608 |
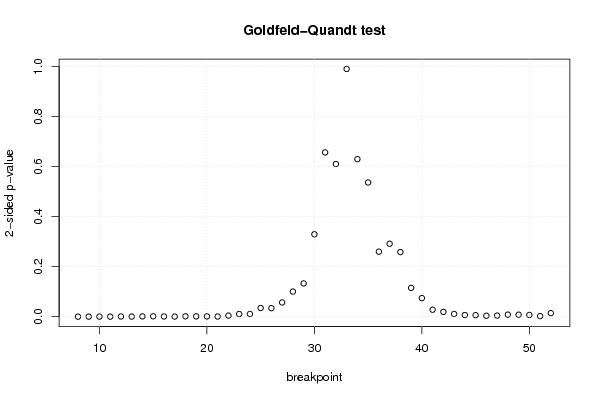
| Goldfeld-Quandt test for Heteroskedasticity | |||
| p-values | Alternative Hypothesis | ||
| breakpoint index | greater | 2-sided | less |
| 8 | 3.76366296160732e-08 | 7.52732592321464e-08 | 0.99999996236337 |
| 9 | 2.80759746850787e-10 | 5.61519493701573e-10 | 0.99999999971924 |
| 10 | 1.24271534583977e-12 | 2.48543069167954e-12 | 0.999999999998757 |
| 11 | 4.10903499396709e-15 | 8.21806998793418e-15 | 0.999999999999996 |
| 12 | 0.000405144578051417 | 0.000810289156102834 | 0.999594855421949 |
| 13 | 0.00011658636083702 | 0.00023317272167404 | 0.999883413639163 |
| 14 | 0.000580666544648691 | 0.00116133308929738 | 0.999419333455351 |
| 15 | 0.000680859339492355 | 0.00136171867898471 | 0.999319140660508 |
| 16 | 0.000376237620056905 | 0.000752475240113809 | 0.999623762379943 |
| 17 | 0.000185202803846961 | 0.000370405607693922 | 0.999814797196153 |
| 18 | 0.00069755833334466 | 0.00139511666668932 | 0.999302441666655 |
| 19 | 0.000567482327770644 | 0.00113496465554129 | 0.999432517672229 |
| 20 | 0.000506448000073716 | 0.00101289600014743 | 0.999493551999926 |
| 21 | 0.000281801700911814 | 0.000563603401823628 | 0.999718198299088 |
| 22 | 0.00210869806693447 | 0.00421739613386895 | 0.997891301933066 |
| 23 | 0.00528168935863156 | 0.0105633787172631 | 0.994718310641368 |
| 24 | 0.00537266607295237 | 0.0107453321459047 | 0.994627333927048 |
| 25 | 0.0172279400129446 | 0.0344558800258893 | 0.982772059987055 |
| 26 | 0.0169352391192566 | 0.0338704782385132 | 0.983064760880743 |
| 27 | 0.0283739344325143 | 0.0567478688650286 | 0.971626065567486 |
| 28 | 0.0501117010642965 | 0.100223402128593 | 0.949888298935704 |
| 29 | 0.0664515914139908 | 0.132903182827982 | 0.933548408586009 |
| 30 | 0.164672034901232 | 0.329344069802464 | 0.835327965098768 |
| 31 | 0.328253702370449 | 0.656507404740897 | 0.671746297629552 |
| 32 | 0.305075650043073 | 0.610151300086146 | 0.694924349956927 |
| 33 | 0.495137021145282 | 0.990274042290563 | 0.504862978854718 |
| 34 | 0.685176699918996 | 0.629646600162007 | 0.314823300081004 |
| 35 | 0.731801518855483 | 0.536396962289034 | 0.268198481144517 |
| 36 | 0.870086395305753 | 0.259827209388495 | 0.129913604694247 |
| 37 | 0.854211110967678 | 0.291577778064643 | 0.145788889032322 |
| 38 | 0.870895761080656 | 0.258208477838689 | 0.129104238919344 |
| 39 | 0.942479764944627 | 0.115040470110746 | 0.0575202350553728 |
| 40 | 0.962973539510249 | 0.0740529209795029 | 0.0370264604897514 |
| 41 | 0.98614379568165 | 0.0277124086367 | 0.01385620431835 |
| 42 | 0.990444991734108 | 0.0191100165317839 | 0.00955500826589193 |
| 43 | 0.994641579908864 | 0.0107168401822713 | 0.00535842009113565 |
| 44 | 0.996752295226484 | 0.00649540954703253 | 0.00324770477351626 |
| 45 | 0.997064737461226 | 0.00587052507754749 | 0.00293526253877374 |
| 46 | 0.99818352694786 | 0.00363294610427899 | 0.0018164730521395 |
| 47 | 0.997863747805195 | 0.00427250438960896 | 0.00213625219480448 |
| 48 | 0.995952932941735 | 0.00809413411653091 | 0.00404706705826546 |
| 49 | 0.996098467432373 | 0.00780306513525346 | 0.00390153256762673 |
| 50 | 0.996528962937217 | 0.00694207412556517 | 0.00347103706278258 |
| 51 | 0.998878495059318 | 0.00224300988136315 | 0.00112150494068157 |
| 52 | 0.992851689039951 | 0.0142966219200985 | 0.00714831096004924 |
| Meta Analysis of Goldfeld-Quandt test for Heteroskedasticity | |||
| Description | # significant tests | % significant tests | OK/NOK |
| 1% type I error level | 23 | 0.511111111111111 | NOK |
| 5% type I error level | 31 | 0.688888888888889 | NOK |
| 10% type I error level | 33 | 0.733333333333333 | NOK |