| Multiple Linear Regression - Estimated Regression Equation |
| nr[t] = + 12.8460138674093 + 0.0135641352768076omzet[t] -0.0367789406935189`Personeel `[t] + e[t] |
| Multiple Linear Regression - Ordinary Least Squares | |||||
| Variable | Parameter | S.D. | T-STAT H0: parameter = 0 | 2-tail p-value | 1-tail p-value |
| (Intercept) | 12.8460138674093 | 4.820075 | 2.6651 | 0.01227 | 0.006135 |
| omzet | 0.0135641352768076 | 0.027997 | 0.4845 | 0.631558 | 0.315779 |
| `Personeel ` | -0.0367789406935189 | 0.077655 | -0.4736 | 0.6392 | 0.3196 |
| Multiple Linear Regression - Regression Statistics | |
| Multiple R | 0.088134518701946 |
| R-squared | 0.00776769338682365 |
| Adjusted R-squared | -0.0583811270540546 |
| F-TEST (value) | 0.117427541943339 |
| F-TEST (DF numerator) | 2 |
| F-TEST (DF denominator) | 30 |
| p-value | 0.889611626785825 |
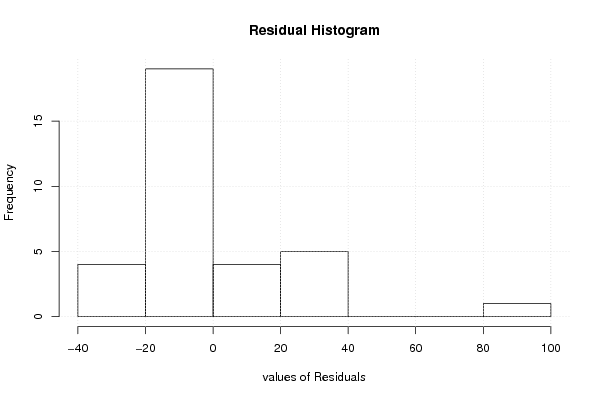
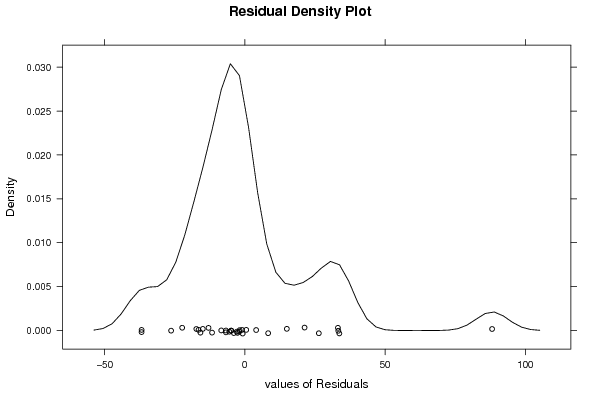
| Multiple Linear Regression - Residual Statistics | |
| Residual Standard Deviation | 24.5721467704117 |
| Sum Squared Residuals | 18113.7119071997 |
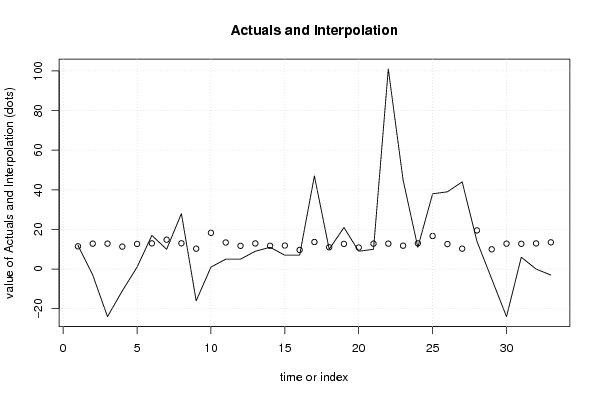
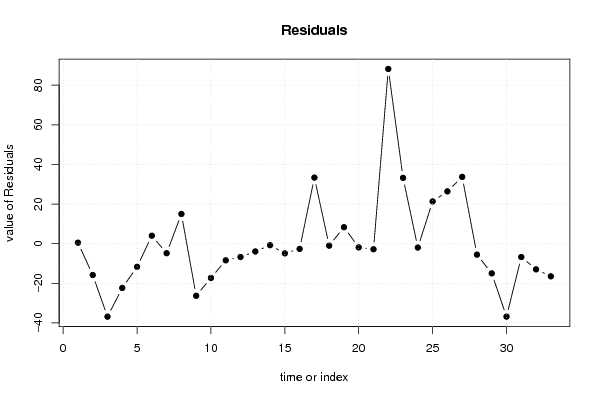
| Multiple Linear Regression - Actuals, Interpolation, and Residuals | |||
| Time or Index | Actuals | Interpolation Forecast | Residuals Prediction Error |
| 1 | 12 | 11.5025191506587 | 0.497480849341304 |
| 2 | -3 | 12.8402766624063 | -15.8402766624063 |
| 3 | -24 | 12.8363631972693 | -36.8363631972693 |
| 4 | -11 | 11.3454485743731 | -22.3454485743731 |
| 5 | 1 | 12.695250624903 | -11.695250624903 |
| 6 | 17 | 12.9798696382781 | 4.02013036172188 |
| 7 | 10 | 14.8290374718703 | -4.82903747187028 |
| 8 | 28 | 13.0260332637068 | 14.9739667362932 |
| 9 | -16 | 10.2999462164401 | -26.2999462164401 |
| 10 | 1 | 18.2935539768889 | -17.2935539768889 |
| 11 | 5 | 13.4144157799785 | -8.4144157799785 |
| 12 | 5 | 11.7473952259216 | -6.74739522592161 |
| 13 | 9 | 12.9422927413705 | -3.94229274137047 |
| 14 | 11 | 11.7734595548564 | -0.773459554856383 |
| 15 | 7 | 11.8926872488296 | -4.89268724882959 |
| 16 | 7 | 9.64970383733436 | -2.64970383733436 |
| 17 | 47 | 13.6726663210473 | 33.3273336789527 |
| 18 | 10 | 11.0098445217716 | -1.00984452177155 |
| 19 | 21 | 12.6973403501738 | 8.3026596498262 |
| 20 | 9 | 10.8691079272566 | -1.8691079272566 |
| 21 | 10 | 12.8363631972694 | -2.83636319726935 |
| 22 | 101 | 12.8402766624063 | 88.1597233375937 |
| 23 | 45 | 11.8117962500113 | 33.1882037499887 |
| 24 | 11 | 12.976184000579 | -1.97618400057904 |
| 25 | 38 | 16.7063604800315 | 21.2936395199685 |
| 26 | 39 | 12.6243525975631 | 26.3756474024369 |
| 27 | 44 | 10.3062153922525 | 33.6937846077475 |
| 28 | 14 | 19.5402760068357 | -5.54027600683572 |
| 29 | -5 | 9.99401245344813 | -14.9940124534481 |
| 30 | -24 | 12.8227990619925 | -36.8227990619925 |
| 31 | 6 | 12.752433005462 | -6.75243300546205 |
| 32 | 0 | 12.9662673450344 | -12.9662673450344 |
| 33 | -3 | 13.5054512617792 | -16.5054512617792 |
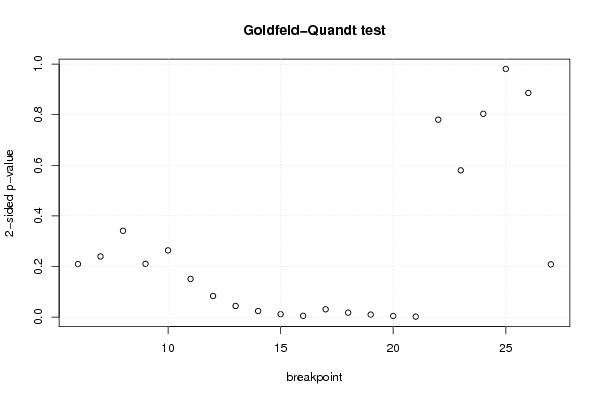
| Goldfeld-Quandt test for Heteroskedasticity | |||
| p-values | Alternative Hypothesis | ||
| breakpoint index | greater | 2-sided | less |
| 6 | 0.104985027757365 | 0.20997005551473 | 0.895014972242635 |
| 7 | 0.119918348183208 | 0.239836696366416 | 0.880081651816792 |
| 8 | 0.17065232125856 | 0.341304642517121 | 0.82934767874144 |
| 9 | 0.105325507256469 | 0.210651014512939 | 0.89467449274353 |
| 10 | 0.132001582881015 | 0.264003165762029 | 0.867998417118985 |
| 11 | 0.075423117757827 | 0.150846235515654 | 0.924576882242173 |
| 12 | 0.0417861698961365 | 0.083572339792273 | 0.958213830103864 |
| 13 | 0.0220851975324377 | 0.0441703950648753 | 0.977914802467562 |
| 14 | 0.0120974377672174 | 0.0241948755344347 | 0.987902562232783 |
| 15 | 0.00580212159189692 | 0.0116042431837938 | 0.994197878408103 |
| 16 | 0.00271823593691504 | 0.00543647187383009 | 0.997281764063085 |
| 17 | 0.0154945729461731 | 0.0309891458923461 | 0.984505427053827 |
| 18 | 0.00885060893142494 | 0.0177012178628499 | 0.991149391068575 |
| 19 | 0.00506618255593539 | 0.0101323651118708 | 0.994933817444065 |
| 20 | 0.00237347071264973 | 0.00474694142529946 | 0.99762652928735 |
| 21 | 0.000975906346306046 | 0.00195181269261209 | 0.999024093653694 |
| 22 | 0.609778228364902 | 0.780443543270196 | 0.390221771635098 |
| 23 | 0.709893343368249 | 0.580213313263502 | 0.290106656631751 |
| 24 | 0.59811880841434 | 0.80376238317132 | 0.40188119158566 |
| 25 | 0.49047368100184 | 0.98094736200368 | 0.50952631899816 |
| 26 | 0.556916800786493 | 0.886166398427015 | 0.443083199213507 |
| 27 | 0.895713430201986 | 0.208573139596027 | 0.104286569798013 |
| Meta Analysis of Goldfeld-Quandt test for Heteroskedasticity | |||
| Description | # significant tests | % significant tests | OK/NOK |
| 1% type I error level | 3 | 0.136363636363636 | NOK |
| 5% type I error level | 9 | 0.409090909090909 | NOK |
| 10% type I error level | 10 | 0.454545454545455 | NOK |