Free Statistics

of Irreproducible Research!

Author's title

Author*The author of this computation has been verified*
R Software Modulerwasp_multipleregression.wasp
Title produced by softwareMultiple Regression
Date of computationThu, 24 Nov 2011 12:10:02 -0500
Cite this page as followsStatistical Computations at FreeStatistics.org, Office for Research Development and Education, URL https://freestatistics.org/blog/index.php?v=date/2011/Nov/24/t13221546437gkx0v75aegtjj5.htm/, Retrieved Wed, 24 Apr 2024 18:24:00 +0000
Statistical Computations at FreeStatistics.org, Office for Research Development and Education, URL https://freestatistics.org/blog/index.php?pk=147102, Retrieved Wed, 24 Apr 2024 18:24:00 +0000
QR Codes:

Original text written by user:
IsPrivate?No (this computation is public)
User-defined keywords
Estimated Impact81
Family? (F = Feedback message, R = changed R code, M = changed R Module, P = changed Parameters, D = changed Data)
-     [Univariate Data Series] [Arabica Price in ...] [2008-01-05 23:14:31] [74be16979710d4c4e7c6647856088456]
- RMPD  [Univariate Data Series] [Data Co2 uitstoot] [2011-11-10 23:08:26] [15a5dd358825f04074b70fc847ec6454]
- R PD    [Univariate Data Series] [Gemiddelde levens...] [2011-11-24 15:49:30] [15a5dd358825f04074b70fc847ec6454]
- R PD      [Univariate Data Series] [GDP in $2005] [2011-11-24 15:52:40] [15a5dd358825f04074b70fc847ec6454]
-   PD        [Univariate Data Series] [Totale populatie ] [2011-11-24 15:54:48] [15a5dd358825f04074b70fc847ec6454]
- RMPD            [Multiple Regression] [Multiple regression ] [2011-11-24 17:10:02] [614dd89c388120cee0dd25886939832b] [Current]
Feedback Forum

Post a new message
Dataseries X:
63.46	60635408600	7175.79	8450000
64.98	64463389370	7533.41	8557000
65.48	66750859382	7749.11	8614000
66.35	69032584255.95	7990.47	8639369
66.80	72841303906.58	8393.42	8678386
68.00	72838685607.53	8343.11	8730405
68.37	75887977453.76	8645.37	8777873
68.63	78936158549.66	8950.31	8819380
68.58	81986612544.38	9244.73	8868475
68.87	85038924238.38	9529.4	8923845
69.24	87328862789.67	9714.96	8989111
69.93	85794984680.72	9477.27	9052707
70.33	88082838620.17	9675.47	9103729
69.65	91885510657.4	10076.6	9118700
70.52	96355573323.8	10512.51	9165800
70.25	101321342608.8	10991.21	9218400
70.06	105791395836.8	11396.13	9283100
70.73	113241494103	12089.41	9367000
70.58	117215849652.8	12406.29	9448100
70.65	120940898880.6	12720.18	9507800
70.94	125658810316.5	13149.04	9556500
70.63	130873880200.8	13647.2	9589800
70.71	139583536623.4	14520.74	9612700
70.97	148226520849	15379.71	9637800
71.10	153789461350	15899.66	9672500
71.44	161871513310.4	16672.14	9709100
71.65	171781295610.4	17639.58	9738400
72.01	178996585758.2	18325.17	9767800
72.00	176620960002	18032.12	9794800
72.15	186604680395	19019.94	9811000
72.80	187772917033.2	19117.97	9821800
72.75	193109744878.6	19645.54	9829700
73.24	197630528464	20090.12	9837200
73.29	206483683756.4	20969.62	9846800
73.70	203906590621.6	20696.13	9852400
73.93	206783719069.34	20979.85	9856303
73.93	206759082201.76	20979.01	9855520
74.43	211878483671.4	21498.94	9855300
74.54	214009149959	21708.75	9858200
74.74	217203709135.4	22024.75	9861800
75.35	222331811922.6	22525.56	9870200
75.66	232825724880	23555.82	9884000
75.73	241180274038.7	24269.23	9937697
76.14	248494123822.1	24925.91	9969310
76.30	253049202253.08	25293.57	10004487
76.46	256922518700.16	25575.57	10045622
76.47	254451243638.75	25229.6	10085426
76.82	262662316800.94	25947.3	10122914
76.97	268926171539.67	26480.95	10155459
77.31	272037080259.13	26725.5	10178934
77.53	281118338865.04	27561.2	10199787
77.62	286389613939.39	28030.61	10217030
77.80	296190694318.91	28937.15	10235655
77.91	307294826961.69	29940.2	10263618
78.22	309697986635.6	30092.08	10291679
78.32	314369521231.48	30485.88	10311970
78.47	317533640477.42	30736.53	10330824
79.12	327005697520.69	31600.02	10348276
79.21	332458473876	32077	10364388
79.55	339794119726.27	32738.41	10379067


Summary of computational transaction
Raw Inputview raw input (R code)
Raw Outputview raw output of R engine
Computing time4 seconds
R Server'Gertrude Mary Cox' @ cox.wessa.net

\begin{tabular}{lllllllll}
\hline
Summary of computational transaction \tabularnewline
Raw Input & view raw input (R code)  \tabularnewline
Raw Output & view raw output of R engine  \tabularnewline
Computing time & 4 seconds \tabularnewline
R Server & 'Gertrude Mary Cox' @ cox.wessa.net \tabularnewline
\hline
\end{tabular}
%Source: https://freestatistics.org/blog/index.php?pk=147102&T=0

[TABLE]
[ROW][C]Summary of computational transaction[/C][/ROW]
[ROW][C]Raw Input[/C][C]view raw input (R code) [/C][/ROW]
[ROW][C]Raw Output[/C][C]view raw output of R engine [/C][/ROW]
[ROW][C]Computing time[/C][C]4 seconds[/C][/ROW]
[ROW][C]R Server[/C][C]'Gertrude Mary Cox' @ cox.wessa.net[/C][/ROW]
[/TABLE]
Source: https://freestatistics.org/blog/index.php?pk=147102&T=0

Globally Unique Identifier (entire table): ba.freestatistics.org/blog/index.php?pk=147102&T=0

As an alternative you can also use a QR Code:  

The GUIDs for individual cells are displayed in the table below:

Summary of computational transaction
Raw Inputview raw input (R code)
Raw Outputview raw output of R engine
Computing time4 seconds
R Server'Gertrude Mary Cox' @ cox.wessa.net


Multiple Linear Regression - Estimated Regression Equation
Levensverwachting[t] = + 43.2565967257155 + 3.65526546336868e-11GDP[t] -6.94535406275099e-05Inkomen[t] + 2.50930862776786e-06Populatie[t] + e[t]

\begin{tabular}{lllllllll}
\hline
Multiple Linear Regression - Estimated Regression Equation \tabularnewline
Levensverwachting[t] =  +  43.2565967257155 +  3.65526546336868e-11GDP[t] -6.94535406275099e-05Inkomen[t] +  2.50930862776786e-06Populatie[t]  + e[t] \tabularnewline
\hline
\end{tabular}
%Source: https://freestatistics.org/blog/index.php?pk=147102&T=1

[TABLE]
[ROW][C]Multiple Linear Regression - Estimated Regression Equation[/C][/ROW]
[ROW][C]Levensverwachting[t] =  +  43.2565967257155 +  3.65526546336868e-11GDP[t] -6.94535406275099e-05Inkomen[t] +  2.50930862776786e-06Populatie[t]  + e[t][/C][/ROW]
[/TABLE]
Source: https://freestatistics.org/blog/index.php?pk=147102&T=1

Globally Unique Identifier (entire table): ba.freestatistics.org/blog/index.php?pk=147102&T=1

As an alternative you can also use a QR Code:  

The GUIDs for individual cells are displayed in the table below:

Multiple Linear Regression - Estimated Regression Equation
Levensverwachting[t] = + 43.2565967257155 + 3.65526546336868e-11GDP[t] -6.94535406275099e-05Inkomen[t] + 2.50930862776786e-06Populatie[t] + e[t]


Multiple Linear Regression - Ordinary Least Squares
VariableParameterS.D.T-STATH0: parameter = 02-tail p-value1-tail p-value
(Intercept)43.25659672571555.5404517.807400
GDP3.65526546336868e-1100.59310.5554790.277739
Inkomen-6.94535406275099e-050.000677-0.10260.9186420.459321
Populatie2.50930862776786e-061e-063.73980.0004350.000217

\begin{tabular}{lllllllll}
\hline
Multiple Linear Regression - Ordinary Least Squares \tabularnewline
Variable & Parameter & S.D. & T-STATH0: parameter = 0 & 2-tail p-value & 1-tail p-value \tabularnewline
(Intercept) & 43.2565967257155 & 5.540451 & 7.8074 & 0 & 0 \tabularnewline
GDP & 3.65526546336868e-11 & 0 & 0.5931 & 0.555479 & 0.277739 \tabularnewline
Inkomen & -6.94535406275099e-05 & 0.000677 & -0.1026 & 0.918642 & 0.459321 \tabularnewline
Populatie & 2.50930862776786e-06 & 1e-06 & 3.7398 & 0.000435 & 0.000217 \tabularnewline
\hline
\end{tabular}
%Source: https://freestatistics.org/blog/index.php?pk=147102&T=2

[TABLE]
[ROW][C]Multiple Linear Regression - Ordinary Least Squares[/C][/ROW]
[ROW][C]Variable[/C][C]Parameter[/C][C]S.D.[/C][C]T-STATH0: parameter = 0[/C][C]2-tail p-value[/C][C]1-tail p-value[/C][/ROW]
[ROW][C](Intercept)[/C][C]43.2565967257155[/C][C]5.540451[/C][C]7.8074[/C][C]0[/C][C]0[/C][/ROW]
[ROW][C]GDP[/C][C]3.65526546336868e-11[/C][C]0[/C][C]0.5931[/C][C]0.555479[/C][C]0.277739[/C][/ROW]
[ROW][C]Inkomen[/C][C]-6.94535406275099e-05[/C][C]0.000677[/C][C]-0.1026[/C][C]0.918642[/C][C]0.459321[/C][/ROW]
[ROW][C]Populatie[/C][C]2.50930862776786e-06[/C][C]1e-06[/C][C]3.7398[/C][C]0.000435[/C][C]0.000217[/C][/ROW]
[/TABLE]
Source: https://freestatistics.org/blog/index.php?pk=147102&T=2

Globally Unique Identifier (entire table): ba.freestatistics.org/blog/index.php?pk=147102&T=2

As an alternative you can also use a QR Code:  

The GUIDs for individual cells are displayed in the table below:

Multiple Linear Regression - Ordinary Least Squares
VariableParameterS.D.T-STATH0: parameter = 02-tail p-value1-tail p-value
(Intercept)43.25659672571555.5404517.807400
GDP3.65526546336868e-1100.59310.5554790.277739
Inkomen-6.94535406275099e-050.000677-0.10260.9186420.459321
Populatie2.50930862776786e-061e-063.73980.0004350.000217


Multiple Linear Regression - Regression Statistics
Multiple R0.978685976143453
R-squared0.957826239899863
Adjusted R-squared0.95556693132307
F-TEST (value)423.946622315507
F-TEST (DF numerator)3
F-TEST (DF denominator)56
p-value0
Multiple Linear Regression - Residual Statistics
Residual Standard Deviation0.833482795613895
Sum Squared Residuals38.9028399527239

\begin{tabular}{lllllllll}
\hline
Multiple Linear Regression - Regression Statistics \tabularnewline
Multiple R & 0.978685976143453 \tabularnewline
R-squared & 0.957826239899863 \tabularnewline
Adjusted R-squared & 0.95556693132307 \tabularnewline
F-TEST (value) & 423.946622315507 \tabularnewline
F-TEST (DF numerator) & 3 \tabularnewline
F-TEST (DF denominator) & 56 \tabularnewline
p-value & 0 \tabularnewline
Multiple Linear Regression - Residual Statistics \tabularnewline
Residual Standard Deviation & 0.833482795613895 \tabularnewline
Sum Squared Residuals & 38.9028399527239 \tabularnewline
\hline
\end{tabular}
%Source: https://freestatistics.org/blog/index.php?pk=147102&T=3

[TABLE]
[ROW][C]Multiple Linear Regression - Regression Statistics[/C][/ROW]
[ROW][C]Multiple R[/C][C]0.978685976143453[/C][/ROW]
[ROW][C]R-squared[/C][C]0.957826239899863[/C][/ROW]
[ROW][C]Adjusted R-squared[/C][C]0.95556693132307[/C][/ROW]
[ROW][C]F-TEST (value)[/C][C]423.946622315507[/C][/ROW]
[ROW][C]F-TEST (DF numerator)[/C][C]3[/C][/ROW]
[ROW][C]F-TEST (DF denominator)[/C][C]56[/C][/ROW]
[ROW][C]p-value[/C][C]0[/C][/ROW]
[ROW][C]Multiple Linear Regression - Residual Statistics[/C][/ROW]
[ROW][C]Residual Standard Deviation[/C][C]0.833482795613895[/C][/ROW]
[ROW][C]Sum Squared Residuals[/C][C]38.9028399527239[/C][/ROW]
[/TABLE]
Source: https://freestatistics.org/blog/index.php?pk=147102&T=3

Globally Unique Identifier (entire table): ba.freestatistics.org/blog/index.php?pk=147102&T=3

As an alternative you can also use a QR Code:  

The GUIDs for individual cells are displayed in the table below:

Multiple Linear Regression - Regression Statistics
Multiple R0.978685976143453
R-squared0.957826239899863
Adjusted R-squared0.95556693132307
F-TEST (value)423.946622315507
F-TEST (DF numerator)3
F-TEST (DF denominator)56
p-value0
Multiple Linear Regression - Residual Statistics
Residual Standard Deviation0.833482795613895
Sum Squared Residuals38.9028399527239


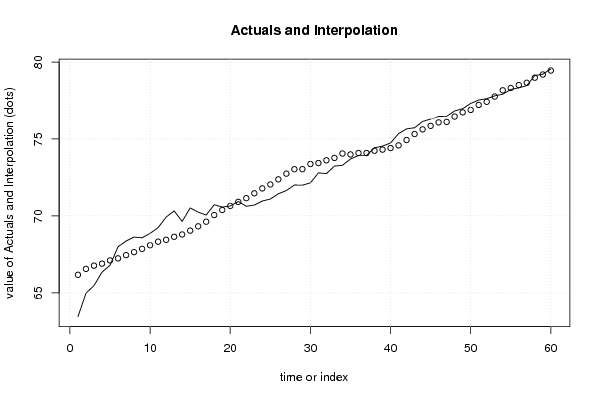
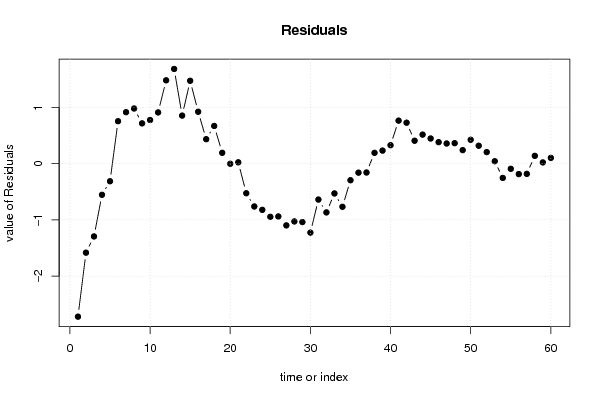
Multiple Linear Regression - Actuals, Interpolation, and Residuals
Time or IndexActualsInterpolationForecastResidualsPrediction Error
163.4666.1782557571827-2.71825575718273
264.9866.561836664185-1.58183666418495
365.4866.7734992285879-1.29349922858791
466.3566.9037976738865-0.553797673886495
566.867.1129358784063-0.312935878406271
66867.24686610576220.753133894237807
768.3767.45644465224760.913555347752436
868.6367.65083847364070.979161526359252
968.5867.86508666063440.714913339365593
1068.8768.09582583512860.77417416487138
1169.2468.33041390602730.909586093972645
1269.9368.4504369928241.479563007176
1370.3368.64832838077861.68167161922136
1469.6568.79703309915510.852966900844919
1570.5269.04833869946391.47166130053612
1670.2569.32859297305120.921407026948752
1770.0669.62621442543420.433785574565784
1870.7370.06091553756910.669084462430864
1970.5870.38768527513040.192314724869614
2070.6570.6518506662578-0.00185066625780684
2170.9470.91672033830540.0232796616946301
2270.6371.1563059881824-0.526305988182401
2370.7171.4714597730719-0.761459773071902
2470.9771.7907089292388-0.820708929238818
2571.172.0450098130539-0.945009813053896
2671.4472.3786194918063-0.93861949180627
2771.6572.7471789511621-1.09717895116211
2872.0173.037073980754-1.02707398075404
297273.0383432459794-1.0383432459794
3072.1573.3753179327312-1.2253179327312
3172.873.4383120856899-0.638312085689926
3272.7573.6165692444928-0.866569244492783
3373.2473.7697580451796-0.529758045179636
3473.2974.0563693468458-0.766369346845795
3573.773.9952167286723-0.295216728672326
3673.9374.0904718841867-0.160471884186659
3773.9374.0876648935933-0.157664893593337
3874.4374.23812958016770.191870419832294
3974.5474.30871603677950.231283963220542
4074.7474.4125718472830.327428152717036
4175.3574.58631278218110.76368721781888
4275.6674.93296641256520.72703358743477
4375.7375.32354085754950.406459142450478
4476.1475.62459950531520.515400494684838
4576.375.8538343748840.446165625115987
4676.4676.07904888520740.380951114792615
4776.4776.11262658345340.357373416546611
4876.8276.45698526065220.363014739347742
4976.9776.73054734692750.239452653072533
5077.3176.88618047562320.423819524376797
5177.5377.21240887399670.317591126003339
5277.6277.41575379343120.204246206568822
5377.877.75778276005250.0422172399475031
5477.9178.1641707087825-0.254170708782534
5578.2278.3118776800259-0.0918776800258541
5678.3278.5062002477853-0.186200247785306
5778.4778.6517591807116-0.181759180711597
5879.1278.98180802686020.138191973139823
5979.2179.18842350857270.0215764914273455
6079.5579.44745771289320.102542287106828

\begin{tabular}{lllllllll}
\hline
Multiple Linear Regression - Actuals, Interpolation, and Residuals \tabularnewline
Time or Index & Actuals & InterpolationForecast & ResidualsPrediction Error \tabularnewline
1 & 63.46 & 66.1782557571827 & -2.71825575718273 \tabularnewline
2 & 64.98 & 66.561836664185 & -1.58183666418495 \tabularnewline
3 & 65.48 & 66.7734992285879 & -1.29349922858791 \tabularnewline
4 & 66.35 & 66.9037976738865 & -0.553797673886495 \tabularnewline
5 & 66.8 & 67.1129358784063 & -0.312935878406271 \tabularnewline
6 & 68 & 67.2468661057622 & 0.753133894237807 \tabularnewline
7 & 68.37 & 67.4564446522476 & 0.913555347752436 \tabularnewline
8 & 68.63 & 67.6508384736407 & 0.979161526359252 \tabularnewline
9 & 68.58 & 67.8650866606344 & 0.714913339365593 \tabularnewline
10 & 68.87 & 68.0958258351286 & 0.77417416487138 \tabularnewline
11 & 69.24 & 68.3304139060273 & 0.909586093972645 \tabularnewline
12 & 69.93 & 68.450436992824 & 1.479563007176 \tabularnewline
13 & 70.33 & 68.6483283807786 & 1.68167161922136 \tabularnewline
14 & 69.65 & 68.7970330991551 & 0.852966900844919 \tabularnewline
15 & 70.52 & 69.0483386994639 & 1.47166130053612 \tabularnewline
16 & 70.25 & 69.3285929730512 & 0.921407026948752 \tabularnewline
17 & 70.06 & 69.6262144254342 & 0.433785574565784 \tabularnewline
18 & 70.73 & 70.0609155375691 & 0.669084462430864 \tabularnewline
19 & 70.58 & 70.3876852751304 & 0.192314724869614 \tabularnewline
20 & 70.65 & 70.6518506662578 & -0.00185066625780684 \tabularnewline
21 & 70.94 & 70.9167203383054 & 0.0232796616946301 \tabularnewline
22 & 70.63 & 71.1563059881824 & -0.526305988182401 \tabularnewline
23 & 70.71 & 71.4714597730719 & -0.761459773071902 \tabularnewline
24 & 70.97 & 71.7907089292388 & -0.820708929238818 \tabularnewline
25 & 71.1 & 72.0450098130539 & -0.945009813053896 \tabularnewline
26 & 71.44 & 72.3786194918063 & -0.93861949180627 \tabularnewline
27 & 71.65 & 72.7471789511621 & -1.09717895116211 \tabularnewline
28 & 72.01 & 73.037073980754 & -1.02707398075404 \tabularnewline
29 & 72 & 73.0383432459794 & -1.0383432459794 \tabularnewline
30 & 72.15 & 73.3753179327312 & -1.2253179327312 \tabularnewline
31 & 72.8 & 73.4383120856899 & -0.638312085689926 \tabularnewline
32 & 72.75 & 73.6165692444928 & -0.866569244492783 \tabularnewline
33 & 73.24 & 73.7697580451796 & -0.529758045179636 \tabularnewline
34 & 73.29 & 74.0563693468458 & -0.766369346845795 \tabularnewline
35 & 73.7 & 73.9952167286723 & -0.295216728672326 \tabularnewline
36 & 73.93 & 74.0904718841867 & -0.160471884186659 \tabularnewline
37 & 73.93 & 74.0876648935933 & -0.157664893593337 \tabularnewline
38 & 74.43 & 74.2381295801677 & 0.191870419832294 \tabularnewline
39 & 74.54 & 74.3087160367795 & 0.231283963220542 \tabularnewline
40 & 74.74 & 74.412571847283 & 0.327428152717036 \tabularnewline
41 & 75.35 & 74.5863127821811 & 0.76368721781888 \tabularnewline
42 & 75.66 & 74.9329664125652 & 0.72703358743477 \tabularnewline
43 & 75.73 & 75.3235408575495 & 0.406459142450478 \tabularnewline
44 & 76.14 & 75.6245995053152 & 0.515400494684838 \tabularnewline
45 & 76.3 & 75.853834374884 & 0.446165625115987 \tabularnewline
46 & 76.46 & 76.0790488852074 & 0.380951114792615 \tabularnewline
47 & 76.47 & 76.1126265834534 & 0.357373416546611 \tabularnewline
48 & 76.82 & 76.4569852606522 & 0.363014739347742 \tabularnewline
49 & 76.97 & 76.7305473469275 & 0.239452653072533 \tabularnewline
50 & 77.31 & 76.8861804756232 & 0.423819524376797 \tabularnewline
51 & 77.53 & 77.2124088739967 & 0.317591126003339 \tabularnewline
52 & 77.62 & 77.4157537934312 & 0.204246206568822 \tabularnewline
53 & 77.8 & 77.7577827600525 & 0.0422172399475031 \tabularnewline
54 & 77.91 & 78.1641707087825 & -0.254170708782534 \tabularnewline
55 & 78.22 & 78.3118776800259 & -0.0918776800258541 \tabularnewline
56 & 78.32 & 78.5062002477853 & -0.186200247785306 \tabularnewline
57 & 78.47 & 78.6517591807116 & -0.181759180711597 \tabularnewline
58 & 79.12 & 78.9818080268602 & 0.138191973139823 \tabularnewline
59 & 79.21 & 79.1884235085727 & 0.0215764914273455 \tabularnewline
60 & 79.55 & 79.4474577128932 & 0.102542287106828 \tabularnewline
\hline
\end{tabular}
%Source: https://freestatistics.org/blog/index.php?pk=147102&T=4

[TABLE]
[ROW][C]Multiple Linear Regression - Actuals, Interpolation, and Residuals[/C][/ROW]
[ROW][C]Time or Index[/C][C]Actuals[/C][C]InterpolationForecast[/C][C]ResidualsPrediction Error[/C][/ROW]
[ROW][C]1[/C][C]63.46[/C][C]66.1782557571827[/C][C]-2.71825575718273[/C][/ROW]
[ROW][C]2[/C][C]64.98[/C][C]66.561836664185[/C][C]-1.58183666418495[/C][/ROW]
[ROW][C]3[/C][C]65.48[/C][C]66.7734992285879[/C][C]-1.29349922858791[/C][/ROW]
[ROW][C]4[/C][C]66.35[/C][C]66.9037976738865[/C][C]-0.553797673886495[/C][/ROW]
[ROW][C]5[/C][C]66.8[/C][C]67.1129358784063[/C][C]-0.312935878406271[/C][/ROW]
[ROW][C]6[/C][C]68[/C][C]67.2468661057622[/C][C]0.753133894237807[/C][/ROW]
[ROW][C]7[/C][C]68.37[/C][C]67.4564446522476[/C][C]0.913555347752436[/C][/ROW]
[ROW][C]8[/C][C]68.63[/C][C]67.6508384736407[/C][C]0.979161526359252[/C][/ROW]
[ROW][C]9[/C][C]68.58[/C][C]67.8650866606344[/C][C]0.714913339365593[/C][/ROW]
[ROW][C]10[/C][C]68.87[/C][C]68.0958258351286[/C][C]0.77417416487138[/C][/ROW]
[ROW][C]11[/C][C]69.24[/C][C]68.3304139060273[/C][C]0.909586093972645[/C][/ROW]
[ROW][C]12[/C][C]69.93[/C][C]68.450436992824[/C][C]1.479563007176[/C][/ROW]
[ROW][C]13[/C][C]70.33[/C][C]68.6483283807786[/C][C]1.68167161922136[/C][/ROW]
[ROW][C]14[/C][C]69.65[/C][C]68.7970330991551[/C][C]0.852966900844919[/C][/ROW]
[ROW][C]15[/C][C]70.52[/C][C]69.0483386994639[/C][C]1.47166130053612[/C][/ROW]
[ROW][C]16[/C][C]70.25[/C][C]69.3285929730512[/C][C]0.921407026948752[/C][/ROW]
[ROW][C]17[/C][C]70.06[/C][C]69.6262144254342[/C][C]0.433785574565784[/C][/ROW]
[ROW][C]18[/C][C]70.73[/C][C]70.0609155375691[/C][C]0.669084462430864[/C][/ROW]
[ROW][C]19[/C][C]70.58[/C][C]70.3876852751304[/C][C]0.192314724869614[/C][/ROW]
[ROW][C]20[/C][C]70.65[/C][C]70.6518506662578[/C][C]-0.00185066625780684[/C][/ROW]
[ROW][C]21[/C][C]70.94[/C][C]70.9167203383054[/C][C]0.0232796616946301[/C][/ROW]
[ROW][C]22[/C][C]70.63[/C][C]71.1563059881824[/C][C]-0.526305988182401[/C][/ROW]
[ROW][C]23[/C][C]70.71[/C][C]71.4714597730719[/C][C]-0.761459773071902[/C][/ROW]
[ROW][C]24[/C][C]70.97[/C][C]71.7907089292388[/C][C]-0.820708929238818[/C][/ROW]
[ROW][C]25[/C][C]71.1[/C][C]72.0450098130539[/C][C]-0.945009813053896[/C][/ROW]
[ROW][C]26[/C][C]71.44[/C][C]72.3786194918063[/C][C]-0.93861949180627[/C][/ROW]
[ROW][C]27[/C][C]71.65[/C][C]72.7471789511621[/C][C]-1.09717895116211[/C][/ROW]
[ROW][C]28[/C][C]72.01[/C][C]73.037073980754[/C][C]-1.02707398075404[/C][/ROW]
[ROW][C]29[/C][C]72[/C][C]73.0383432459794[/C][C]-1.0383432459794[/C][/ROW]
[ROW][C]30[/C][C]72.15[/C][C]73.3753179327312[/C][C]-1.2253179327312[/C][/ROW]
[ROW][C]31[/C][C]72.8[/C][C]73.4383120856899[/C][C]-0.638312085689926[/C][/ROW]
[ROW][C]32[/C][C]72.75[/C][C]73.6165692444928[/C][C]-0.866569244492783[/C][/ROW]
[ROW][C]33[/C][C]73.24[/C][C]73.7697580451796[/C][C]-0.529758045179636[/C][/ROW]
[ROW][C]34[/C][C]73.29[/C][C]74.0563693468458[/C][C]-0.766369346845795[/C][/ROW]
[ROW][C]35[/C][C]73.7[/C][C]73.9952167286723[/C][C]-0.295216728672326[/C][/ROW]
[ROW][C]36[/C][C]73.93[/C][C]74.0904718841867[/C][C]-0.160471884186659[/C][/ROW]
[ROW][C]37[/C][C]73.93[/C][C]74.0876648935933[/C][C]-0.157664893593337[/C][/ROW]
[ROW][C]38[/C][C]74.43[/C][C]74.2381295801677[/C][C]0.191870419832294[/C][/ROW]
[ROW][C]39[/C][C]74.54[/C][C]74.3087160367795[/C][C]0.231283963220542[/C][/ROW]
[ROW][C]40[/C][C]74.74[/C][C]74.412571847283[/C][C]0.327428152717036[/C][/ROW]
[ROW][C]41[/C][C]75.35[/C][C]74.5863127821811[/C][C]0.76368721781888[/C][/ROW]
[ROW][C]42[/C][C]75.66[/C][C]74.9329664125652[/C][C]0.72703358743477[/C][/ROW]
[ROW][C]43[/C][C]75.73[/C][C]75.3235408575495[/C][C]0.406459142450478[/C][/ROW]
[ROW][C]44[/C][C]76.14[/C][C]75.6245995053152[/C][C]0.515400494684838[/C][/ROW]
[ROW][C]45[/C][C]76.3[/C][C]75.853834374884[/C][C]0.446165625115987[/C][/ROW]
[ROW][C]46[/C][C]76.46[/C][C]76.0790488852074[/C][C]0.380951114792615[/C][/ROW]
[ROW][C]47[/C][C]76.47[/C][C]76.1126265834534[/C][C]0.357373416546611[/C][/ROW]
[ROW][C]48[/C][C]76.82[/C][C]76.4569852606522[/C][C]0.363014739347742[/C][/ROW]
[ROW][C]49[/C][C]76.97[/C][C]76.7305473469275[/C][C]0.239452653072533[/C][/ROW]
[ROW][C]50[/C][C]77.31[/C][C]76.8861804756232[/C][C]0.423819524376797[/C][/ROW]
[ROW][C]51[/C][C]77.53[/C][C]77.2124088739967[/C][C]0.317591126003339[/C][/ROW]
[ROW][C]52[/C][C]77.62[/C][C]77.4157537934312[/C][C]0.204246206568822[/C][/ROW]
[ROW][C]53[/C][C]77.8[/C][C]77.7577827600525[/C][C]0.0422172399475031[/C][/ROW]
[ROW][C]54[/C][C]77.91[/C][C]78.1641707087825[/C][C]-0.254170708782534[/C][/ROW]
[ROW][C]55[/C][C]78.22[/C][C]78.3118776800259[/C][C]-0.0918776800258541[/C][/ROW]
[ROW][C]56[/C][C]78.32[/C][C]78.5062002477853[/C][C]-0.186200247785306[/C][/ROW]
[ROW][C]57[/C][C]78.47[/C][C]78.6517591807116[/C][C]-0.181759180711597[/C][/ROW]
[ROW][C]58[/C][C]79.12[/C][C]78.9818080268602[/C][C]0.138191973139823[/C][/ROW]
[ROW][C]59[/C][C]79.21[/C][C]79.1884235085727[/C][C]0.0215764914273455[/C][/ROW]
[ROW][C]60[/C][C]79.55[/C][C]79.4474577128932[/C][C]0.102542287106828[/C][/ROW]
[/TABLE]
Source: https://freestatistics.org/blog/index.php?pk=147102&T=4

Globally Unique Identifier (entire table): ba.freestatistics.org/blog/index.php?pk=147102&T=4

As an alternative you can also use a QR Code:  

The GUIDs for individual cells are displayed in the table below:

Multiple Linear Regression - Actuals, Interpolation, and Residuals
Time or IndexActualsInterpolationForecastResidualsPrediction Error
163.4666.1782557571827-2.71825575718273
264.9866.561836664185-1.58183666418495
365.4866.7734992285879-1.29349922858791
466.3566.9037976738865-0.553797673886495
566.867.1129358784063-0.312935878406271
66867.24686610576220.753133894237807
768.3767.45644465224760.913555347752436
868.6367.65083847364070.979161526359252
968.5867.86508666063440.714913339365593
1068.8768.09582583512860.77417416487138
1169.2468.33041390602730.909586093972645
1269.9368.4504369928241.479563007176
1370.3368.64832838077861.68167161922136
1469.6568.79703309915510.852966900844919
1570.5269.04833869946391.47166130053612
1670.2569.32859297305120.921407026948752
1770.0669.62621442543420.433785574565784
1870.7370.06091553756910.669084462430864
1970.5870.38768527513040.192314724869614
2070.6570.6518506662578-0.00185066625780684
2170.9470.91672033830540.0232796616946301
2270.6371.1563059881824-0.526305988182401
2370.7171.4714597730719-0.761459773071902
2470.9771.7907089292388-0.820708929238818
2571.172.0450098130539-0.945009813053896
2671.4472.3786194918063-0.93861949180627
2771.6572.7471789511621-1.09717895116211
2872.0173.037073980754-1.02707398075404
297273.0383432459794-1.0383432459794
3072.1573.3753179327312-1.2253179327312
3172.873.4383120856899-0.638312085689926
3272.7573.6165692444928-0.866569244492783
3373.2473.7697580451796-0.529758045179636
3473.2974.0563693468458-0.766369346845795
3573.773.9952167286723-0.295216728672326
3673.9374.0904718841867-0.160471884186659
3773.9374.0876648935933-0.157664893593337
3874.4374.23812958016770.191870419832294
3974.5474.30871603677950.231283963220542
4074.7474.4125718472830.327428152717036
4175.3574.58631278218110.76368721781888
4275.6674.93296641256520.72703358743477
4375.7375.32354085754950.406459142450478
4476.1475.62459950531520.515400494684838
4576.375.8538343748840.446165625115987
4676.4676.07904888520740.380951114792615
4776.4776.11262658345340.357373416546611
4876.8276.45698526065220.363014739347742
4976.9776.73054734692750.239452653072533
5077.3176.88618047562320.423819524376797
5177.5377.21240887399670.317591126003339
5277.6277.41575379343120.204246206568822
5377.877.75778276005250.0422172399475031
5477.9178.1641707087825-0.254170708782534
5578.2278.3118776800259-0.0918776800258541
5678.3278.5062002477853-0.186200247785306
5778.4778.6517591807116-0.181759180711597
5879.1278.98180802686020.138191973139823
5979.2179.18842350857270.0215764914273455
6079.5579.44745771289320.102542287106828


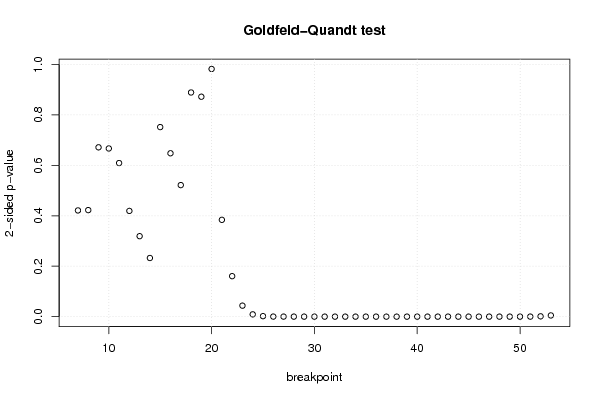
Goldfeld-Quandt test for Heteroskedasticity
p-valuesAlternative Hypothesis
breakpoint indexgreater2-sidedless
70.2106343227943150.4212686455886310.789365677205685
80.2113187992126060.4226375984252120.788681200787394
90.3358065799140620.6716131598281240.664193420085938
100.3334964216229470.6669928432458950.666503578377053
110.3046183489731580.6092366979463170.695381651026842
120.2097174255263330.4194348510526650.790282574473667
130.1595751490563460.3191502981126910.840424850943654
140.1163143400796680.2326286801593350.883685659920332
150.3759184928548710.7518369857097410.624081507145129
160.3239841909477250.6479683818954490.676015809052275
170.2608689959401610.5217379918803220.739131004059839
180.4445311241587930.8890622483175850.555468875841207
190.4361024953284790.8722049906569570.563897504671521
200.4912038182926350.9824076365852690.508796181707366
210.8079611060002810.3840777879994380.192038893999719
220.9197321882514630.1605356234970750.0802678117485373
230.9782065132879360.04358697342412850.0217934867120642
240.99546482559740.009070348805199920.00453517440259996
250.9989968001890370.002006399621926680.00100319981096334
260.9998660048140760.0002679903718475730.000133995185923786
270.9999081225209650.0001837549580702919.18774790351456e-05
280.9999451175466370.000109764906726715.48824533633548e-05
290.9999746848047895.06303904221633e-052.53151952110816e-05
300.9999893607409562.12785180888439e-051.0639259044422e-05
310.9999955586132528.88277349585421e-064.44138674792711e-06
320.9999964783935017.0432129986481e-063.52160649932405e-06
330.9999965317680616.93646387827516e-063.46823193913758e-06
340.9999998731414482.53717103215468e-071.26858551607734e-07
350.9999999079905681.84018863294789e-079.20094316473946e-08
360.9999999199332071.60133586850199e-078.00667934250997e-08
370.9999999651903416.96193185231712e-083.48096592615856e-08
380.9999999502861979.94276066007613e-084.97138033003806e-08
390.9999999620699347.58601318561072e-083.79300659280536e-08
400.9999999967478356.50432914889813e-093.25216457444907e-09
410.9999999942931361.14137272937713e-085.70686364688565e-09
420.9999999732836055.3432789412154e-082.6716394706077e-08
430.9999999821995623.5600875848794e-081.7800437924397e-08
440.9999999589493938.2101214163033e-084.10506070815165e-08
450.9999998912746112.1745077709666e-071.0872538854833e-07
460.9999996246118317.50776337342971e-073.75388168671485e-07
470.9999990834148761.83317024805705e-069.16585124028524e-07
480.9999966639741656.672051670925e-063.3360258354625e-06
490.9999980794928163.84101436699146e-061.92050718349573e-06
500.999991431268251.71374634997697e-058.56873174988486e-06
510.9999226922458930.0001546155082143167.73077541071578e-05
520.9993382560461630.001323487907674090.000661743953837044
530.9976031126507330.004793774698534170.00239688734926708

\begin{tabular}{lllllllll}
\hline
Goldfeld-Quandt test for Heteroskedasticity \tabularnewline
p-values & Alternative Hypothesis \tabularnewline
breakpoint index & greater & 2-sided & less \tabularnewline
7 & 0.210634322794315 & 0.421268645588631 & 0.789365677205685 \tabularnewline
8 & 0.211318799212606 & 0.422637598425212 & 0.788681200787394 \tabularnewline
9 & 0.335806579914062 & 0.671613159828124 & 0.664193420085938 \tabularnewline
10 & 0.333496421622947 & 0.666992843245895 & 0.666503578377053 \tabularnewline
11 & 0.304618348973158 & 0.609236697946317 & 0.695381651026842 \tabularnewline
12 & 0.209717425526333 & 0.419434851052665 & 0.790282574473667 \tabularnewline
13 & 0.159575149056346 & 0.319150298112691 & 0.840424850943654 \tabularnewline
14 & 0.116314340079668 & 0.232628680159335 & 0.883685659920332 \tabularnewline
15 & 0.375918492854871 & 0.751836985709741 & 0.624081507145129 \tabularnewline
16 & 0.323984190947725 & 0.647968381895449 & 0.676015809052275 \tabularnewline
17 & 0.260868995940161 & 0.521737991880322 & 0.739131004059839 \tabularnewline
18 & 0.444531124158793 & 0.889062248317585 & 0.555468875841207 \tabularnewline
19 & 0.436102495328479 & 0.872204990656957 & 0.563897504671521 \tabularnewline
20 & 0.491203818292635 & 0.982407636585269 & 0.508796181707366 \tabularnewline
21 & 0.807961106000281 & 0.384077787999438 & 0.192038893999719 \tabularnewline
22 & 0.919732188251463 & 0.160535623497075 & 0.0802678117485373 \tabularnewline
23 & 0.978206513287936 & 0.0435869734241285 & 0.0217934867120642 \tabularnewline
24 & 0.9954648255974 & 0.00907034880519992 & 0.00453517440259996 \tabularnewline
25 & 0.998996800189037 & 0.00200639962192668 & 0.00100319981096334 \tabularnewline
26 & 0.999866004814076 & 0.000267990371847573 & 0.000133995185923786 \tabularnewline
27 & 0.999908122520965 & 0.000183754958070291 & 9.18774790351456e-05 \tabularnewline
28 & 0.999945117546637 & 0.00010976490672671 & 5.48824533633548e-05 \tabularnewline
29 & 0.999974684804789 & 5.06303904221633e-05 & 2.53151952110816e-05 \tabularnewline
30 & 0.999989360740956 & 2.12785180888439e-05 & 1.0639259044422e-05 \tabularnewline
31 & 0.999995558613252 & 8.88277349585421e-06 & 4.44138674792711e-06 \tabularnewline
32 & 0.999996478393501 & 7.0432129986481e-06 & 3.52160649932405e-06 \tabularnewline
33 & 0.999996531768061 & 6.93646387827516e-06 & 3.46823193913758e-06 \tabularnewline
34 & 0.999999873141448 & 2.53717103215468e-07 & 1.26858551607734e-07 \tabularnewline
35 & 0.999999907990568 & 1.84018863294789e-07 & 9.20094316473946e-08 \tabularnewline
36 & 0.999999919933207 & 1.60133586850199e-07 & 8.00667934250997e-08 \tabularnewline
37 & 0.999999965190341 & 6.96193185231712e-08 & 3.48096592615856e-08 \tabularnewline
38 & 0.999999950286197 & 9.94276066007613e-08 & 4.97138033003806e-08 \tabularnewline
39 & 0.999999962069934 & 7.58601318561072e-08 & 3.79300659280536e-08 \tabularnewline
40 & 0.999999996747835 & 6.50432914889813e-09 & 3.25216457444907e-09 \tabularnewline
41 & 0.999999994293136 & 1.14137272937713e-08 & 5.70686364688565e-09 \tabularnewline
42 & 0.999999973283605 & 5.3432789412154e-08 & 2.6716394706077e-08 \tabularnewline
43 & 0.999999982199562 & 3.5600875848794e-08 & 1.7800437924397e-08 \tabularnewline
44 & 0.999999958949393 & 8.2101214163033e-08 & 4.10506070815165e-08 \tabularnewline
45 & 0.999999891274611 & 2.1745077709666e-07 & 1.0872538854833e-07 \tabularnewline
46 & 0.999999624611831 & 7.50776337342971e-07 & 3.75388168671485e-07 \tabularnewline
47 & 0.999999083414876 & 1.83317024805705e-06 & 9.16585124028524e-07 \tabularnewline
48 & 0.999996663974165 & 6.672051670925e-06 & 3.3360258354625e-06 \tabularnewline
49 & 0.999998079492816 & 3.84101436699146e-06 & 1.92050718349573e-06 \tabularnewline
50 & 0.99999143126825 & 1.71374634997697e-05 & 8.56873174988486e-06 \tabularnewline
51 & 0.999922692245893 & 0.000154615508214316 & 7.73077541071578e-05 \tabularnewline
52 & 0.999338256046163 & 0.00132348790767409 & 0.000661743953837044 \tabularnewline
53 & 0.997603112650733 & 0.00479377469853417 & 0.00239688734926708 \tabularnewline
\hline
\end{tabular}
%Source: https://freestatistics.org/blog/index.php?pk=147102&T=5

[TABLE]
[ROW][C]Goldfeld-Quandt test for Heteroskedasticity[/C][/ROW]
[ROW][C]p-values[/C][C]Alternative Hypothesis[/C][/ROW]
[ROW][C]breakpoint index[/C][C]greater[/C][C]2-sided[/C][C]less[/C][/ROW]
[ROW][C]7[/C][C]0.210634322794315[/C][C]0.421268645588631[/C][C]0.789365677205685[/C][/ROW]
[ROW][C]8[/C][C]0.211318799212606[/C][C]0.422637598425212[/C][C]0.788681200787394[/C][/ROW]
[ROW][C]9[/C][C]0.335806579914062[/C][C]0.671613159828124[/C][C]0.664193420085938[/C][/ROW]
[ROW][C]10[/C][C]0.333496421622947[/C][C]0.666992843245895[/C][C]0.666503578377053[/C][/ROW]
[ROW][C]11[/C][C]0.304618348973158[/C][C]0.609236697946317[/C][C]0.695381651026842[/C][/ROW]
[ROW][C]12[/C][C]0.209717425526333[/C][C]0.419434851052665[/C][C]0.790282574473667[/C][/ROW]
[ROW][C]13[/C][C]0.159575149056346[/C][C]0.319150298112691[/C][C]0.840424850943654[/C][/ROW]
[ROW][C]14[/C][C]0.116314340079668[/C][C]0.232628680159335[/C][C]0.883685659920332[/C][/ROW]
[ROW][C]15[/C][C]0.375918492854871[/C][C]0.751836985709741[/C][C]0.624081507145129[/C][/ROW]
[ROW][C]16[/C][C]0.323984190947725[/C][C]0.647968381895449[/C][C]0.676015809052275[/C][/ROW]
[ROW][C]17[/C][C]0.260868995940161[/C][C]0.521737991880322[/C][C]0.739131004059839[/C][/ROW]
[ROW][C]18[/C][C]0.444531124158793[/C][C]0.889062248317585[/C][C]0.555468875841207[/C][/ROW]
[ROW][C]19[/C][C]0.436102495328479[/C][C]0.872204990656957[/C][C]0.563897504671521[/C][/ROW]
[ROW][C]20[/C][C]0.491203818292635[/C][C]0.982407636585269[/C][C]0.508796181707366[/C][/ROW]
[ROW][C]21[/C][C]0.807961106000281[/C][C]0.384077787999438[/C][C]0.192038893999719[/C][/ROW]
[ROW][C]22[/C][C]0.919732188251463[/C][C]0.160535623497075[/C][C]0.0802678117485373[/C][/ROW]
[ROW][C]23[/C][C]0.978206513287936[/C][C]0.0435869734241285[/C][C]0.0217934867120642[/C][/ROW]
[ROW][C]24[/C][C]0.9954648255974[/C][C]0.00907034880519992[/C][C]0.00453517440259996[/C][/ROW]
[ROW][C]25[/C][C]0.998996800189037[/C][C]0.00200639962192668[/C][C]0.00100319981096334[/C][/ROW]
[ROW][C]26[/C][C]0.999866004814076[/C][C]0.000267990371847573[/C][C]0.000133995185923786[/C][/ROW]
[ROW][C]27[/C][C]0.999908122520965[/C][C]0.000183754958070291[/C][C]9.18774790351456e-05[/C][/ROW]
[ROW][C]28[/C][C]0.999945117546637[/C][C]0.00010976490672671[/C][C]5.48824533633548e-05[/C][/ROW]
[ROW][C]29[/C][C]0.999974684804789[/C][C]5.06303904221633e-05[/C][C]2.53151952110816e-05[/C][/ROW]
[ROW][C]30[/C][C]0.999989360740956[/C][C]2.12785180888439e-05[/C][C]1.0639259044422e-05[/C][/ROW]
[ROW][C]31[/C][C]0.999995558613252[/C][C]8.88277349585421e-06[/C][C]4.44138674792711e-06[/C][/ROW]
[ROW][C]32[/C][C]0.999996478393501[/C][C]7.0432129986481e-06[/C][C]3.52160649932405e-06[/C][/ROW]
[ROW][C]33[/C][C]0.999996531768061[/C][C]6.93646387827516e-06[/C][C]3.46823193913758e-06[/C][/ROW]
[ROW][C]34[/C][C]0.999999873141448[/C][C]2.53717103215468e-07[/C][C]1.26858551607734e-07[/C][/ROW]
[ROW][C]35[/C][C]0.999999907990568[/C][C]1.84018863294789e-07[/C][C]9.20094316473946e-08[/C][/ROW]
[ROW][C]36[/C][C]0.999999919933207[/C][C]1.60133586850199e-07[/C][C]8.00667934250997e-08[/C][/ROW]
[ROW][C]37[/C][C]0.999999965190341[/C][C]6.96193185231712e-08[/C][C]3.48096592615856e-08[/C][/ROW]
[ROW][C]38[/C][C]0.999999950286197[/C][C]9.94276066007613e-08[/C][C]4.97138033003806e-08[/C][/ROW]
[ROW][C]39[/C][C]0.999999962069934[/C][C]7.58601318561072e-08[/C][C]3.79300659280536e-08[/C][/ROW]
[ROW][C]40[/C][C]0.999999996747835[/C][C]6.50432914889813e-09[/C][C]3.25216457444907e-09[/C][/ROW]
[ROW][C]41[/C][C]0.999999994293136[/C][C]1.14137272937713e-08[/C][C]5.70686364688565e-09[/C][/ROW]
[ROW][C]42[/C][C]0.999999973283605[/C][C]5.3432789412154e-08[/C][C]2.6716394706077e-08[/C][/ROW]
[ROW][C]43[/C][C]0.999999982199562[/C][C]3.5600875848794e-08[/C][C]1.7800437924397e-08[/C][/ROW]
[ROW][C]44[/C][C]0.999999958949393[/C][C]8.2101214163033e-08[/C][C]4.10506070815165e-08[/C][/ROW]
[ROW][C]45[/C][C]0.999999891274611[/C][C]2.1745077709666e-07[/C][C]1.0872538854833e-07[/C][/ROW]
[ROW][C]46[/C][C]0.999999624611831[/C][C]7.50776337342971e-07[/C][C]3.75388168671485e-07[/C][/ROW]
[ROW][C]47[/C][C]0.999999083414876[/C][C]1.83317024805705e-06[/C][C]9.16585124028524e-07[/C][/ROW]
[ROW][C]48[/C][C]0.999996663974165[/C][C]6.672051670925e-06[/C][C]3.3360258354625e-06[/C][/ROW]
[ROW][C]49[/C][C]0.999998079492816[/C][C]3.84101436699146e-06[/C][C]1.92050718349573e-06[/C][/ROW]
[ROW][C]50[/C][C]0.99999143126825[/C][C]1.71374634997697e-05[/C][C]8.56873174988486e-06[/C][/ROW]
[ROW][C]51[/C][C]0.999922692245893[/C][C]0.000154615508214316[/C][C]7.73077541071578e-05[/C][/ROW]
[ROW][C]52[/C][C]0.999338256046163[/C][C]0.00132348790767409[/C][C]0.000661743953837044[/C][/ROW]
[ROW][C]53[/C][C]0.997603112650733[/C][C]0.00479377469853417[/C][C]0.00239688734926708[/C][/ROW]
[/TABLE]
Source: https://freestatistics.org/blog/index.php?pk=147102&T=5

Globally Unique Identifier (entire table): ba.freestatistics.org/blog/index.php?pk=147102&T=5

As an alternative you can also use a QR Code:  

The GUIDs for individual cells are displayed in the table below:

Goldfeld-Quandt test for Heteroskedasticity
p-valuesAlternative Hypothesis
breakpoint indexgreater2-sidedless
70.2106343227943150.4212686455886310.789365677205685
80.2113187992126060.4226375984252120.788681200787394
90.3358065799140620.6716131598281240.664193420085938
100.3334964216229470.6669928432458950.666503578377053
110.3046183489731580.6092366979463170.695381651026842
120.2097174255263330.4194348510526650.790282574473667
130.1595751490563460.3191502981126910.840424850943654
140.1163143400796680.2326286801593350.883685659920332
150.3759184928548710.7518369857097410.624081507145129
160.3239841909477250.6479683818954490.676015809052275
170.2608689959401610.5217379918803220.739131004059839
180.4445311241587930.8890622483175850.555468875841207
190.4361024953284790.8722049906569570.563897504671521
200.4912038182926350.9824076365852690.508796181707366
210.8079611060002810.3840777879994380.192038893999719
220.9197321882514630.1605356234970750.0802678117485373
230.9782065132879360.04358697342412850.0217934867120642
240.99546482559740.009070348805199920.00453517440259996
250.9989968001890370.002006399621926680.00100319981096334
260.9998660048140760.0002679903718475730.000133995185923786
270.9999081225209650.0001837549580702919.18774790351456e-05
280.9999451175466370.000109764906726715.48824533633548e-05
290.9999746848047895.06303904221633e-052.53151952110816e-05
300.9999893607409562.12785180888439e-051.0639259044422e-05
310.9999955586132528.88277349585421e-064.44138674792711e-06
320.9999964783935017.0432129986481e-063.52160649932405e-06
330.9999965317680616.93646387827516e-063.46823193913758e-06
340.9999998731414482.53717103215468e-071.26858551607734e-07
350.9999999079905681.84018863294789e-079.20094316473946e-08
360.9999999199332071.60133586850199e-078.00667934250997e-08
370.9999999651903416.96193185231712e-083.48096592615856e-08
380.9999999502861979.94276066007613e-084.97138033003806e-08
390.9999999620699347.58601318561072e-083.79300659280536e-08
400.9999999967478356.50432914889813e-093.25216457444907e-09
410.9999999942931361.14137272937713e-085.70686364688565e-09
420.9999999732836055.3432789412154e-082.6716394706077e-08
430.9999999821995623.5600875848794e-081.7800437924397e-08
440.9999999589493938.2101214163033e-084.10506070815165e-08
450.9999998912746112.1745077709666e-071.0872538854833e-07
460.9999996246118317.50776337342971e-073.75388168671485e-07
470.9999990834148761.83317024805705e-069.16585124028524e-07
480.9999966639741656.672051670925e-063.3360258354625e-06
490.9999980794928163.84101436699146e-061.92050718349573e-06
500.999991431268251.71374634997697e-058.56873174988486e-06
510.9999226922458930.0001546155082143167.73077541071578e-05
520.9993382560461630.001323487907674090.000661743953837044
530.9976031126507330.004793774698534170.00239688734926708


Meta Analysis of Goldfeld-Quandt test for Heteroskedasticity
Description# significant tests% significant testsOK/NOK
1% type I error level300.638297872340426NOK
5% type I error level310.659574468085106NOK
10% type I error level310.659574468085106NOK

\begin{tabular}{lllllllll}
\hline
Meta Analysis of Goldfeld-Quandt test for Heteroskedasticity \tabularnewline
Description & # significant tests & % significant tests & OK/NOK \tabularnewline
1% type I error level & 30 & 0.638297872340426 & NOK \tabularnewline
5% type I error level & 31 & 0.659574468085106 & NOK \tabularnewline
10% type I error level & 31 & 0.659574468085106 & NOK \tabularnewline
\hline
\end{tabular}
%Source: https://freestatistics.org/blog/index.php?pk=147102&T=6

[TABLE]
[ROW][C]Meta Analysis of Goldfeld-Quandt test for Heteroskedasticity[/C][/ROW]
[ROW][C]Description[/C][C]# significant tests[/C][C]% significant tests[/C][C]OK/NOK[/C][/ROW]
[ROW][C]1% type I error level[/C][C]30[/C][C]0.638297872340426[/C][C]NOK[/C][/ROW]
[ROW][C]5% type I error level[/C][C]31[/C][C]0.659574468085106[/C][C]NOK[/C][/ROW]
[ROW][C]10% type I error level[/C][C]31[/C][C]0.659574468085106[/C][C]NOK[/C][/ROW]
[/TABLE]
Source: https://freestatistics.org/blog/index.php?pk=147102&T=6

Globally Unique Identifier (entire table): ba.freestatistics.org/blog/index.php?pk=147102&T=6

As an alternative you can also use a QR Code:  

The GUIDs for individual cells are displayed in the table below:

Meta Analysis of Goldfeld-Quandt test for Heteroskedasticity
Description# significant tests% significant testsOK/NOK
1% type I error level300.638297872340426NOK
5% type I error level310.659574468085106NOK
10% type I error level310.659574468085106NOK


Parameters (Session):
par1 = 1 ; par2 = Do not include Seasonal Dummies ; par3 = No Linear Trend ;
Parameters (R input):
par1 = 1 ; par2 = Do not include Seasonal Dummies ; par3 = No Linear Trend ;
R code (references can be found in the software module):
library(lattice)
library(lmtest)
n25 <- 25 #minimum number of obs. for Goldfeld-Quandt test
par1 <- as.numeric(par1)
x <- t(y)
k <- length(x[1,])
n <- length(x[,1])
x1 <- cbind(x[,par1], x[,1:k!=par1])
mycolnames <- c(colnames(x)[par1], colnames(x)[1:k!=par1])
colnames(x1) <- mycolnames #colnames(x)[par1]
x <- x1
if (par3 == 'First Differences'){
x2 <- array(0, dim=c(n-1,k), dimnames=list(1:(n-1), paste('(1-B)',colnames(x),sep='')))
for (i in 1:n-1) {
for (j in 1:k) {
x2[i,j] <- x[i+1,j] - x[i,j]
}
}
x <- x2
}
if (par2 == 'Include Monthly Dummies'){
x2 <- array(0, dim=c(n,11), dimnames=list(1:n, paste('M', seq(1:11), sep ='')))
for (i in 1:11){
x2[seq(i,n,12),i] <- 1
}
x <- cbind(x, x2)
}
if (par2 == 'Include Quarterly Dummies'){
x2 <- array(0, dim=c(n,3), dimnames=list(1:n, paste('Q', seq(1:3), sep ='')))
for (i in 1:3){
x2[seq(i,n,4),i] <- 1
}
x <- cbind(x, x2)
}
k <- length(x[1,])
if (par3 == 'Linear Trend'){
x <- cbind(x, c(1:n))
colnames(x)[k+1] <- 't'
}
x
k <- length(x[1,])
df <- as.data.frame(x)
(mylm <- lm(df))
(mysum <- summary(mylm))
if (n > n25) {
kp3 <- k + 3
nmkm3 <- n - k - 3
gqarr <- array(NA, dim=c(nmkm3-kp3+1,3))
numgqtests <- 0
numsignificant1 <- 0
numsignificant5 <- 0
numsignificant10 <- 0
for (mypoint in kp3:nmkm3) {
j <- 0
numgqtests <- numgqtests + 1
for (myalt in c('greater', 'two.sided', 'less')) {
j <- j + 1
gqarr[mypoint-kp3+1,j] <- gqtest(mylm, point=mypoint, alternative=myalt)$p.value
}
if (gqarr[mypoint-kp3+1,2] < 0.01) numsignificant1 <- numsignificant1 + 1
if (gqarr[mypoint-kp3+1,2] < 0.05) numsignificant5 <- numsignificant5 + 1
if (gqarr[mypoint-kp3+1,2] < 0.10) numsignificant10 <- numsignificant10 + 1
}
gqarr
}
bitmap(file='test0.png')
plot(x[,1], type='l', main='Actuals and Interpolation', ylab='value of Actuals and Interpolation (dots)', xlab='time or index')
points(x[,1]-mysum$resid)
grid()
dev.off()
bitmap(file='test1.png')
plot(mysum$resid, type='b', pch=19, main='Residuals', ylab='value of Residuals', xlab='time or index')
grid()
dev.off()
bitmap(file='test2.png')
hist(mysum$resid, main='Residual Histogram', xlab='values of Residuals')
grid()
dev.off()
bitmap(file='test3.png')
densityplot(~mysum$resid,col='black',main='Residual Density Plot', xlab='values of Residuals')
dev.off()
bitmap(file='test4.png')
qqnorm(mysum$resid, main='Residual Normal Q-Q Plot')
qqline(mysum$resid)
grid()
dev.off()
(myerror <- as.ts(mysum$resid))
bitmap(file='test5.png')
dum <- cbind(lag(myerror,k=1),myerror)
dum
dum1 <- dum[2:length(myerror),]
dum1
z <- as.data.frame(dum1)
z
plot(z,main=paste('Residual Lag plot, lowess, and regression line'), ylab='values of Residuals', xlab='lagged values of Residuals')
lines(lowess(z))
abline(lm(z))
grid()
dev.off()
bitmap(file='test6.png')
acf(mysum$resid, lag.max=length(mysum$resid)/2, main='Residual Autocorrelation Function')
grid()
dev.off()
bitmap(file='test7.png')
pacf(mysum$resid, lag.max=length(mysum$resid)/2, main='Residual Partial Autocorrelation Function')
grid()
dev.off()
bitmap(file='test8.png')
opar <- par(mfrow = c(2,2), oma = c(0, 0, 1.1, 0))
plot(mylm, las = 1, sub='Residual Diagnostics')
par(opar)
dev.off()
if (n > n25) {
bitmap(file='test9.png')
plot(kp3:nmkm3,gqarr[,2], main='Goldfeld-Quandt test',ylab='2-sided p-value',xlab='breakpoint')
grid()
dev.off()
}
load(file='createtable')
a<-table.start()
a<-table.row.start(a)
a<-table.element(a, 'Multiple Linear Regression - Estimated Regression Equation', 1, TRUE)
a<-table.row.end(a)
myeq <- colnames(x)[1]
myeq <- paste(myeq, '[t] = ', sep='')
for (i in 1:k){
if (mysum$coefficients[i,1] > 0) myeq <- paste(myeq, '+', '')
myeq <- paste(myeq, mysum$coefficients[i,1], sep=' ')
if (rownames(mysum$coefficients)[i] != '(Intercept)') {
myeq <- paste(myeq, rownames(mysum$coefficients)[i], sep='')
if (rownames(mysum$coefficients)[i] != 't') myeq <- paste(myeq, '[t]', sep='')
}
}
myeq <- paste(myeq, ' + e[t]')
a<-table.row.start(a)
a<-table.element(a, myeq)
a<-table.row.end(a)
a<-table.end(a)
table.save(a,file='mytable1.tab')
a<-table.start()
a<-table.row.start(a)
a<-table.element(a,hyperlink('ols1.htm','Multiple Linear Regression - Ordinary Least Squares',''), 6, TRUE)
a<-table.row.end(a)
a<-table.row.start(a)
a<-table.element(a,'Variable',header=TRUE)
a<-table.element(a,'Parameter',header=TRUE)
a<-table.element(a,'S.D.',header=TRUE)
a<-table.element(a,'T-STAT
H0: parameter = 0',header=TRUE)
a<-table.element(a,'2-tail p-value',header=TRUE)
a<-table.element(a,'1-tail p-value',header=TRUE)
a<-table.row.end(a)
for (i in 1:k){
a<-table.row.start(a)
a<-table.element(a,rownames(mysum$coefficients)[i],header=TRUE)
a<-table.element(a,mysum$coefficients[i,1])
a<-table.element(a, round(mysum$coefficients[i,2],6))
a<-table.element(a, round(mysum$coefficients[i,3],4))
a<-table.element(a, round(mysum$coefficients[i,4],6))
a<-table.element(a, round(mysum$coefficients[i,4]/2,6))
a<-table.row.end(a)
}
a<-table.end(a)
table.save(a,file='mytable2.tab')
a<-table.start()
a<-table.row.start(a)
a<-table.element(a, 'Multiple Linear Regression - Regression Statistics', 2, TRUE)
a<-table.row.end(a)
a<-table.row.start(a)
a<-table.element(a, 'Multiple R',1,TRUE)
a<-table.element(a, sqrt(mysum$r.squared))
a<-table.row.end(a)
a<-table.row.start(a)
a<-table.element(a, 'R-squared',1,TRUE)
a<-table.element(a, mysum$r.squared)
a<-table.row.end(a)
a<-table.row.start(a)
a<-table.element(a, 'Adjusted R-squared',1,TRUE)
a<-table.element(a, mysum$adj.r.squared)
a<-table.row.end(a)
a<-table.row.start(a)
a<-table.element(a, 'F-TEST (value)',1,TRUE)
a<-table.element(a, mysum$fstatistic[1])
a<-table.row.end(a)
a<-table.row.start(a)
a<-table.element(a, 'F-TEST (DF numerator)',1,TRUE)
a<-table.element(a, mysum$fstatistic[2])
a<-table.row.end(a)
a<-table.row.start(a)
a<-table.element(a, 'F-TEST (DF denominator)',1,TRUE)
a<-table.element(a, mysum$fstatistic[3])
a<-table.row.end(a)
a<-table.row.start(a)
a<-table.element(a, 'p-value',1,TRUE)
a<-table.element(a, 1-pf(mysum$fstatistic[1],mysum$fstatistic[2],mysum$fstatistic[3]))
a<-table.row.end(a)
a<-table.row.start(a)
a<-table.element(a, 'Multiple Linear Regression - Residual Statistics', 2, TRUE)
a<-table.row.end(a)
a<-table.row.start(a)
a<-table.element(a, 'Residual Standard Deviation',1,TRUE)
a<-table.element(a, mysum$sigma)
a<-table.row.end(a)
a<-table.row.start(a)
a<-table.element(a, 'Sum Squared Residuals',1,TRUE)
a<-table.element(a, sum(myerror*myerror))
a<-table.row.end(a)
a<-table.end(a)
table.save(a,file='mytable3.tab')
a<-table.start()
a<-table.row.start(a)
a<-table.element(a, 'Multiple Linear Regression - Actuals, Interpolation, and Residuals', 4, TRUE)
a<-table.row.end(a)
a<-table.row.start(a)
a<-table.element(a, 'Time or Index', 1, TRUE)
a<-table.element(a, 'Actuals', 1, TRUE)
a<-table.element(a, 'Interpolation
Forecast', 1, TRUE)
a<-table.element(a, 'Residuals
Prediction Error', 1, TRUE)
a<-table.row.end(a)
for (i in 1:n) {
a<-table.row.start(a)
a<-table.element(a,i, 1, TRUE)
a<-table.element(a,x[i])
a<-table.element(a,x[i]-mysum$resid[i])
a<-table.element(a,mysum$resid[i])
a<-table.row.end(a)
}
a<-table.end(a)
table.save(a,file='mytable4.tab')
if (n > n25) {
a<-table.start()
a<-table.row.start(a)
a<-table.element(a,'Goldfeld-Quandt test for Heteroskedasticity',4,TRUE)
a<-table.row.end(a)
a<-table.row.start(a)
a<-table.element(a,'p-values',header=TRUE)
a<-table.element(a,'Alternative Hypothesis',3,header=TRUE)
a<-table.row.end(a)
a<-table.row.start(a)
a<-table.element(a,'breakpoint index',header=TRUE)
a<-table.element(a,'greater',header=TRUE)
a<-table.element(a,'2-sided',header=TRUE)
a<-table.element(a,'less',header=TRUE)
a<-table.row.end(a)
for (mypoint in kp3:nmkm3) {
a<-table.row.start(a)
a<-table.element(a,mypoint,header=TRUE)
a<-table.element(a,gqarr[mypoint-kp3+1,1])
a<-table.element(a,gqarr[mypoint-kp3+1,2])
a<-table.element(a,gqarr[mypoint-kp3+1,3])
a<-table.row.end(a)
}
a<-table.end(a)
table.save(a,file='mytable5.tab')
a<-table.start()
a<-table.row.start(a)
a<-table.element(a,'Meta Analysis of Goldfeld-Quandt test for Heteroskedasticity',4,TRUE)
a<-table.row.end(a)
a<-table.row.start(a)
a<-table.element(a,'Description',header=TRUE)
a<-table.element(a,'# significant tests',header=TRUE)
a<-table.element(a,'% significant tests',header=TRUE)
a<-table.element(a,'OK/NOK',header=TRUE)
a<-table.row.end(a)
a<-table.row.start(a)
a<-table.element(a,'1% type I error level',header=TRUE)
a<-table.element(a,numsignificant1)
a<-table.element(a,numsignificant1/numgqtests)
if (numsignificant1/numgqtests < 0.01) dum <- 'OK' else dum <- 'NOK'
a<-table.element(a,dum)
a<-table.row.end(a)
a<-table.row.start(a)
a<-table.element(a,'5% type I error level',header=TRUE)
a<-table.element(a,numsignificant5)
a<-table.element(a,numsignificant5/numgqtests)
if (numsignificant5/numgqtests < 0.05) dum <- 'OK' else dum <- 'NOK'
a<-table.element(a,dum)
a<-table.row.end(a)
a<-table.row.start(a)
a<-table.element(a,'10% type I error level',header=TRUE)
a<-table.element(a,numsignificant10)
a<-table.element(a,numsignificant10/numgqtests)
if (numsignificant10/numgqtests < 0.1) dum <- 'OK' else dum <- 'NOK'
a<-table.element(a,dum)
a<-table.row.end(a)
a<-table.end(a)
table.save(a,file='mytable6.tab')
}