| Multiple Linear Regression - Estimated Regression Equation |
| Levensverwachting[t] = + 79.2164682073907 + 2.39562431403025e-11GDP[t] -0.000809558126717591Inkomen[t] -1.1512971934826e-06Populatie[t] + 0.503587183622271t + e[t] |
| Multiple Linear Regression - Ordinary Least Squares | |||||
| Variable | Parameter | S.D. | T-STAT H0: parameter = 0 | 2-tail p-value | 1-tail p-value |
| (Intercept) | 79.2164682073907 | 5.196631 | 15.2438 | 0 | 0 |
| GDP | 2.39562431403025e-11 | 0 | 0.6183 | 0.538906 | 0.269453 |
| Inkomen | -0.000809558126717591 | 0.000433 | -1.8712 | 0.066639 | 0.033319 |
| Populatie | -1.1512971934826e-06 | 1e-06 | -1.9981 | 0.050656 | 0.025328 |
| t | 0.503587183622271 | 0.054034 | 9.3199 | 0 | 0 |
| Multiple Linear Regression - Regression Statistics | |
| Multiple R | 0.991790788244371 |
| R-squared | 0.98364896764639 |
| Adjusted R-squared | 0.982459801657037 |
| F-TEST (value) | 827.175496484886 |
| F-TEST (DF numerator) | 4 |
| F-TEST (DF denominator) | 55 |
| p-value | 0 |
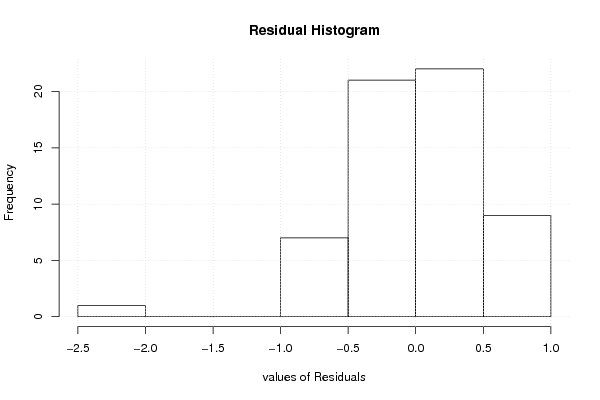
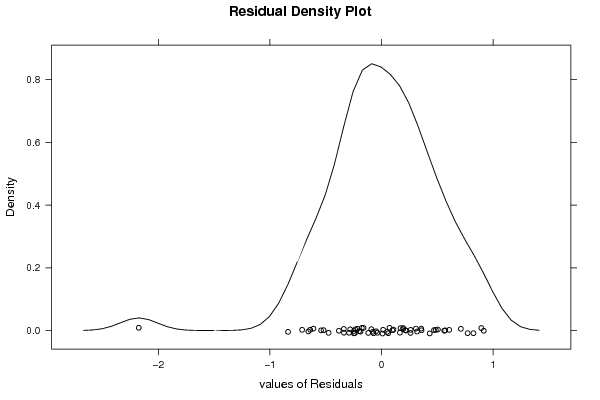
| Multiple Linear Regression - Residual Statistics | |
| Residual Standard Deviation | 0.523673666876463 |
| Sum Squared Residuals | 15.0828760158912 |
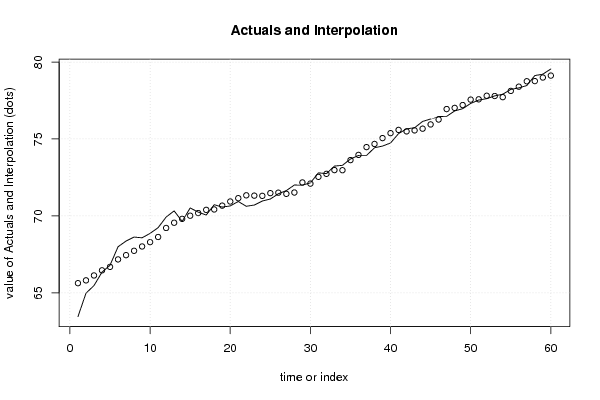
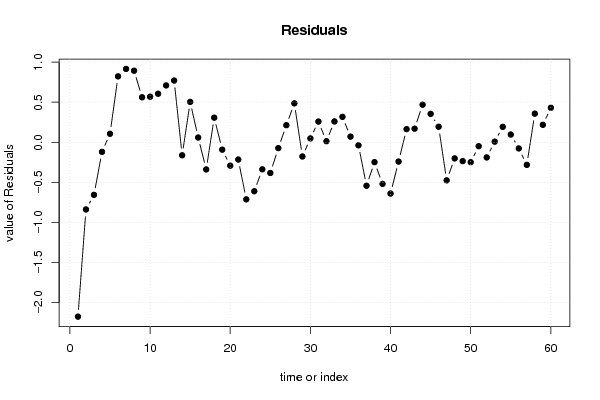
| Multiple Linear Regression - Actuals, Interpolation, and Residuals | |||
| Time or Index | Actuals | Interpolation Forecast | Residuals Prediction Error |
| 1 | 63.46 | 65.6349715872993 | -2.17497158729926 |
| 2 | 64.98 | 65.8175598320048 | -0.837559832004771 |
| 3 | 65.48 | 66.1357005754492 | -0.655700575449176 |
| 4 | 66.35 | 66.4693471069651 | -0.11934710696506 |
| 5 | 66.8 | 66.6930452948321 | 0.106954705167896 |
| 6 | 68 | 67.1774092944931 | 0.822590705506894 |
| 7 | 68.37 | 67.4546992404275 | 0.915300759572492 |
| 8 | 68.63 | 67.7366558437477 | 0.893344156252301 |
| 9 | 68.58 | 68.0184474055736 | 0.561552594426436 |
| 10 | 68.87 | 68.3009522727415 | 0.569047727258547 |
| 11 | 69.24 | 68.6340356124512 | 0.605964387548763 |
| 12 | 69.93 | 69.2200828139707 | 0.709917186029314 |
| 13 | 70.33 | 69.5592824767146 | 0.770717523285367 |
| 14 | 69.65 | 69.8119932745898 | -0.161993274589751 |
| 15 | 70.52 | 70.0155457854702 | 0.504454214529797 |
| 16 | 70.25 | 70.1900004378257 | 0.0599995621743192 |
| 17 | 70.06 | 70.3983780983392 | -0.3383780983392 |
| 18 | 70.73 | 70.4225973548217 | 0.30740264517826 |
| 19 | 70.58 | 70.6714921847353 | -0.0914921847353252 |
| 20 | 70.65 | 70.9414729105221 | -0.291472910522066 |
| 21 | 70.94 | 71.1548282560705 | -0.214828256070469 |
| 22 | 70.63 | 71.3417212488861 | -0.711721248886097 |
| 23 | 70.71 | 71.320412967693 | -0.610412967693036 |
| 24 | 70.97 | 71.3067698792185 | -0.336769879218552 |
| 25 | 71.1 | 71.4827444574572 | -0.382744457457161 |
| 26 | 71.44 | 71.5124423039071 | -0.0724423039070603 |
| 27 | 71.65 | 71.4364987198949 | 0.21350128010512 |
| 28 | 72.01 | 71.524064055041 | 0.485935944959022 |
| 29 | 72 | 72.1768961552479 | -0.176896155247921 |
| 30 | 72.15 | 72.1013070487811 | 0.0486929512188988 |
| 31 | 72.8 | 72.5410858005018 | 0.258914199498231 |
| 32 | 72.75 | 72.7363295008455 | 0.013670499154536 |
| 33 | 73.24 | 72.979669594297 | 0.260330405702955 |
| 34 | 73.29 | 72.9722862931574 | 0.31771370684266 |
| 35 | 73.7 | 73.6290947948396 | 0.0709052051603692 |
| 36 | 73.93 | 73.9674258224434 | -0.0374258224433616 |
| 37 | 73.93 | 74.4720042938046 | -0.54200429380461 |
| 38 | 74.43 | 74.6775728323247 | -0.247572832324686 |
| 39 | 74.54 | 75.0590106231558 | -0.51901062315583 |
| 40 | 74.74 | 75.3791624051947 | -0.639162405194739 |
| 41 | 75.35 | 75.5904939641689 | -0.240493964168944 |
| 42 | 75.66 | 75.4955326211897 | 0.164467378810267 |
| 43 | 75.73 | 75.5598953472054 | 0.170104652794609 |
| 44 | 76.14 | 75.6706783057 | 0.46932169430003 |
| 45 | 76.3 | 75.9452467334938 | 0.354753266506179 |
| 46 | 76.46 | 76.2659700258934 | 0.194029974106591 |
| 47 | 76.47 | 76.9446113348891 | -0.474611334889075 |
| 48 | 76.82 | 77.0207252868931 | -0.200725286893095 |
| 49 | 76.97 | 77.2048812361472 | -0.234881236147177 |
| 50 | 77.31 | 77.5579899639343 | -0.247989963934324 |
| 51 | 77.53 | 77.5785742598662 | -0.0485742598661556 |
| 52 | 77.62 | 77.8085748930592 | -0.188574893059243 |
| 53 | 77.8 | 77.7916194068678 | 0.00838059313223037 |
| 54 | 77.91 | 77.7169988895172 | 0.193001110482784 |
| 55 | 78.22 | 78.1228945117604 | 0.0971054882395426 |
| 56 | 78.32 | 78.3962291523456 | -0.0762291523456274 |
| 57 | 78.47 | 78.7509944442009 | -0.280994444200858 |
| 58 | 79.12 | 78.7623587439305 | 0.357641256069519 |
| 59 | 79.21 | 78.9918812280471 | 0.218118771952887 |
| 60 | 79.55 | 79.1188531951542 | 0.431146804845812 |
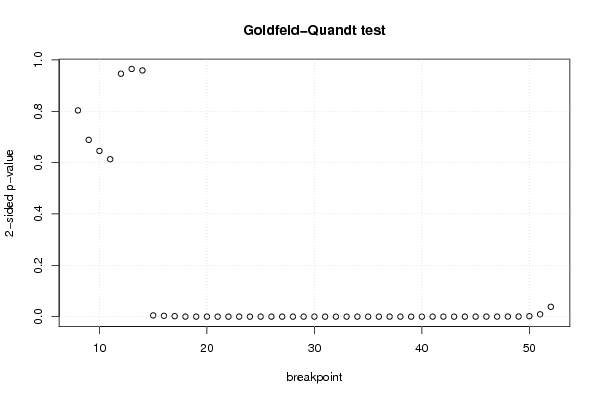
| Goldfeld-Quandt test for Heteroskedasticity | |||
| p-values | Alternative Hypothesis | ||
| breakpoint index | greater | 2-sided | less |
| 8 | 0.401664585249174 | 0.803329170498349 | 0.598335414750826 |
| 9 | 0.344314738632289 | 0.688629477264578 | 0.655685261367711 |
| 10 | 0.322712020789547 | 0.645424041579094 | 0.677287979210453 |
| 11 | 0.306538084430383 | 0.613076168860766 | 0.693461915569617 |
| 12 | 0.473116793651503 | 0.946233587303007 | 0.526883206348497 |
| 13 | 0.48238241990093 | 0.96476483980186 | 0.51761758009907 |
| 14 | 0.520457664655683 | 0.959084670688634 | 0.479542335344317 |
| 15 | 0.99758314266912 | 0.00483371466175974 | 0.00241685733087987 |
| 16 | 0.998364900840612 | 0.00327019831877664 | 0.00163509915938832 |
| 17 | 0.999066059680009 | 0.00186788063998289 | 0.000933940319991447 |
| 18 | 0.999941699294088 | 0.000116601411823784 | 5.83007059118919e-05 |
| 19 | 0.999928366487398 | 0.000143267025204109 | 7.16335126020544e-05 |
| 20 | 0.999948359033489 | 0.00010328193302189 | 5.16409665109452e-05 |
| 21 | 0.999999782350328 | 4.3529934345616e-07 | 2.1764967172808e-07 |
| 22 | 0.999999920316928 | 1.59366144426487e-07 | 7.96830722132435e-08 |
| 23 | 0.999999978725696 | 4.25486079337485e-08 | 2.12743039668743e-08 |
| 24 | 0.999999992540354 | 1.49192917918832e-08 | 7.45964589594159e-09 |
| 25 | 0.999999992547244 | 1.49055118566326e-08 | 7.45275592831629e-09 |
| 26 | 0.999999997179147 | 5.64170575254682e-09 | 2.82085287627341e-09 |
| 27 | 0.999999997446383 | 5.10723310535203e-09 | 2.55361655267602e-09 |
| 28 | 0.999999998789256 | 2.42148870360835e-09 | 1.21074435180417e-09 |
| 29 | 0.999999997132122 | 5.73575629753952e-09 | 2.86787814876976e-09 |
| 30 | 0.999999994748525 | 1.05029493451749e-08 | 5.25147467258745e-09 |
| 31 | 0.999999996790873 | 6.41825426960034e-09 | 3.20912713480017e-09 |
| 32 | 0.999999988193744 | 2.36125129053527e-08 | 1.18062564526763e-08 |
| 33 | 0.999999980673169 | 3.86536618124719e-08 | 1.93268309062359e-08 |
| 34 | 0.999999944199879 | 1.11600241725705e-07 | 5.58001208628524e-08 |
| 35 | 0.999999880777679 | 2.38444642763842e-07 | 1.19222321381921e-07 |
| 36 | 0.999999861611935 | 2.76776129592673e-07 | 1.38388064796336e-07 |
| 37 | 0.999999702045183 | 5.95909634692276e-07 | 2.97954817346138e-07 |
| 38 | 0.999999687822754 | 6.24354491290713e-07 | 3.12177245645356e-07 |
| 39 | 0.999999288166879 | 1.42366624292201e-06 | 7.11833121461007e-07 |
| 40 | 0.999999037033065 | 1.92593386989076e-06 | 9.62966934945381e-07 |
| 41 | 0.999996817332294 | 6.36533541144463e-06 | 3.18266770572232e-06 |
| 42 | 0.999989778350146 | 2.04432997080946e-05 | 1.02216498540473e-05 |
| 43 | 0.999991996692617 | 1.60066147653462e-05 | 8.00330738267312e-06 |
| 44 | 0.999986465082542 | 2.70698349166207e-05 | 1.35349174583104e-05 |
| 45 | 0.999968654351186 | 6.26912976283926e-05 | 3.13456488141963e-05 |
| 46 | 0.999907808918834 | 0.000184382162332513 | 9.21910811662564e-05 |
| 47 | 0.999904313253653 | 0.000191373492694773 | 9.56867463473863e-05 |
| 48 | 0.99977091462142 | 0.00045817075715978 | 0.00022908537857989 |
| 49 | 0.999739161028323 | 0.00052167794335294 | 0.00026083897167647 |
| 50 | 0.999078453785128 | 0.00184309242974331 | 0.000921546214871655 |
| 51 | 0.995415410640083 | 0.00916917871983484 | 0.00458458935991742 |
| 52 | 0.980818959572159 | 0.0383620808556816 | 0.0191810404278408 |
| Meta Analysis of Goldfeld-Quandt test for Heteroskedasticity | |||
| Description | # significant tests | % significant tests | OK/NOK |
| 1% type I error level | 37 | 0.822222222222222 | NOK |
| 5% type I error level | 38 | 0.844444444444444 | NOK |
| 10% type I error level | 38 | 0.844444444444444 | NOK |