Free Statistics

of Irreproducible Research!

Author's title

Author*The author of this computation has been verified*
R Software Modulerwasp_multipleregression.wasp
Title produced by softwareMultiple Regression
Date of computationThu, 24 Nov 2011 14:21:37 -0500
Cite this page as followsStatistical Computations at FreeStatistics.org, Office for Research Development and Education, URL https://freestatistics.org/blog/index.php?v=date/2011/Nov/24/t1322162622jzmrui6aot2zm9q.htm/, Retrieved Sat, 20 Apr 2024 08:07:38 +0000
Statistical Computations at FreeStatistics.org, Office for Research Development and Education, URL https://freestatistics.org/blog/index.php?pk=147163, Retrieved Sat, 20 Apr 2024 08:07:38 +0000
QR Codes:

Original text written by user:
IsPrivate?No (this computation is public)
User-defined keywords
Estimated Impact99
Family? (F = Feedback message, R = changed R code, M = changed R Module, P = changed Parameters, D = changed Data)
-     [Multiple Regression] [Competence to learn] [2010-11-17 07:43:53] [b98453cac15ba1066b407e146608df68]
- R  D  [Multiple Regression] [WS7] [2011-11-24 19:12:28] [430266ea0cf3e59522f72a6c9ff36aef]
-   PD      [Multiple Regression] [WS7 goed] [2011-11-24 19:21:37] [ae47d588931629dc57e50b2172c5fe3b] [Current]
Feedback Forum

Post a new message
Dataseries X:
6.8	225	0.442	0.672	9.2
6.3	180	0.435	0.797	11.7
6.4	190	0.456	0.761	15.8
6.2	180	0.416	0.651	8.6
6.9	205	0.449	0.9 	23.2
6.4	225	0.431	0.78	  27.4
6.3	185	0.487	0.771	9.3
6.8	235	0.469	0.75	  16
6.9	235	0.435	0.818	4.7
6.7	210	0.48 	0.825	12.5
6.9	245	0.516	0.632	20.1
6.9	245	0.493	0.757	9.1
6.3	185	0.374	0.709	8.1
6.1	185	0.424	0.782	8.6
6.2	180	0.441	0.775	20.3
6.8	220	0.503	0.88	  25
6.5	194	0.503	0.833	19.2
7.6	225	0.425	0.571	3.3
6.3	210	0.371	0.816	11.2
7.1	240	0.504	0.714	10.5
6.8	225	0.4	  0.765	10.1
7.3	263	0.482	0.655	7.2
6.4	210	0.475	0.244	13.6
6.8	235	0.428	0.728	9
7.2	230	0.559	0.721	24.6
6.4	190	0.441	0.757	12.6
6.6	220	0.492	0.747	5.6
6.8	210	0.402	0.739	8.7
6.1	180	0.415	0.713	7.7
6.5	235	0.492	0.742	24.1
6.4	185	0.484	0.861	11.7
6	175	0.387	0.721	7.7
6	192	0.436	0.785	9.6
7.3	263	0.482	0.655	7.2
6.1	180	0.34	  0.821	12.3
6.7	240	0.516	0.728	8.9
6.4	210	0.475	0.846	13.6
5.8	160	0.412	0.813	11.2
6.9	230	0.411	0.595	2.8
7	245	0.407	0.573	3.2
7.3	228	0.445	0.726	9.4
5.9	155	0.291	0.707	11.9
6.2	200	0.449	0.804	15.4
6.8	235	0.546	0.784	7.4
7	235	0.48	  0.744	18.9
5.9	105	0.359	0.839	7.9
6.1	180	0.528	0.79	  12.2
5.7	185	0.352	0.701	11
7.1	245	0.414	0.778	2.8
5.8	180	0.425	0.872	11.8
7.4	240	0.599	0.713	17.1
6.8	225	0.482	0.701	11.6
6.8	215	0.457	0.734	5.8
7	230	0.435	0.764	8.3


Summary of computational transaction
Raw Inputview raw input (R code)
Raw Outputview raw output of R engine
Computing time5 seconds
R Server'George Udny Yule' @ yule.wessa.net

\begin{tabular}{lllllllll}
\hline
Summary of computational transaction \tabularnewline
Raw Input & view raw input (R code)  \tabularnewline
Raw Output & view raw output of R engine  \tabularnewline
Computing time & 5 seconds \tabularnewline
R Server & 'George Udny Yule' @ yule.wessa.net \tabularnewline
\hline
\end{tabular}
%Source: https://freestatistics.org/blog/index.php?pk=147163&T=0

[TABLE]
[ROW][C]Summary of computational transaction[/C][/ROW]
[ROW][C]Raw Input[/C][C]view raw input (R code) [/C][/ROW]
[ROW][C]Raw Output[/C][C]view raw output of R engine [/C][/ROW]
[ROW][C]Computing time[/C][C]5 seconds[/C][/ROW]
[ROW][C]R Server[/C][C]'George Udny Yule' @ yule.wessa.net[/C][/ROW]
[/TABLE]
Source: https://freestatistics.org/blog/index.php?pk=147163&T=0

Globally Unique Identifier (entire table): ba.freestatistics.org/blog/index.php?pk=147163&T=0

As an alternative you can also use a QR Code:  

The GUIDs for individual cells are displayed in the table below:

Summary of computational transaction
Raw Inputview raw input (R code)
Raw Outputview raw output of R engine
Computing time5 seconds
R Server'George Udny Yule' @ yule.wessa.net


Multiple Linear Regression - Estimated Regression Equation
hoogte[t] = + 3.79804983737547 + 0.0114890321966031gewicht[t] + 1.1388895664414veldgoal[t] -0.0493155495249556vrijeworp[t] -0.00827334697367462puntpergame[t] + e[t]

\begin{tabular}{lllllllll}
\hline
Multiple Linear Regression - Estimated Regression Equation \tabularnewline
hoogte[t] =  +  3.79804983737547 +  0.0114890321966031gewicht[t] +  1.1388895664414veldgoal[t] -0.0493155495249556vrijeworp[t] -0.00827334697367462puntpergame[t]  + e[t] \tabularnewline
\hline
\end{tabular}
%Source: https://freestatistics.org/blog/index.php?pk=147163&T=1

[TABLE]
[ROW][C]Multiple Linear Regression - Estimated Regression Equation[/C][/ROW]
[ROW][C]hoogte[t] =  +  3.79804983737547 +  0.0114890321966031gewicht[t] +  1.1388895664414veldgoal[t] -0.0493155495249556vrijeworp[t] -0.00827334697367462puntpergame[t]  + e[t][/C][/ROW]
[/TABLE]
Source: https://freestatistics.org/blog/index.php?pk=147163&T=1

Globally Unique Identifier (entire table): ba.freestatistics.org/blog/index.php?pk=147163&T=1

As an alternative you can also use a QR Code:  

The GUIDs for individual cells are displayed in the table below:

Multiple Linear Regression - Estimated Regression Equation
hoogte[t] = + 3.79804983737547 + 0.0114890321966031gewicht[t] + 1.1388895664414veldgoal[t] -0.0493155495249556vrijeworp[t] -0.00827334697367462puntpergame[t] + e[t]


Multiple Linear Regression - Ordinary Least Squares
VariableParameterS.D.T-STATH0: parameter = 02-tail p-value1-tail p-value
(Intercept)3.798049837375470.4484378.469500
gewicht0.01148903219660310.0014547.899300
veldgoal1.13888956644140.7949211.43270.1582910.079145
vrijeworp-0.04931554952495560.380348-0.12970.8973670.448683
puntpergame-0.008273346973674620.00666-1.24230.2200510.110026

\begin{tabular}{lllllllll}
\hline
Multiple Linear Regression - Ordinary Least Squares \tabularnewline
Variable & Parameter & S.D. & T-STATH0: parameter = 0 & 2-tail p-value & 1-tail p-value \tabularnewline
(Intercept) & 3.79804983737547 & 0.448437 & 8.4695 & 0 & 0 \tabularnewline
gewicht & 0.0114890321966031 & 0.001454 & 7.8993 & 0 & 0 \tabularnewline
veldgoal & 1.1388895664414 & 0.794921 & 1.4327 & 0.158291 & 0.079145 \tabularnewline
vrijeworp & -0.0493155495249556 & 0.380348 & -0.1297 & 0.897367 & 0.448683 \tabularnewline
puntpergame & -0.00827334697367462 & 0.00666 & -1.2423 & 0.220051 & 0.110026 \tabularnewline
\hline
\end{tabular}
%Source: https://freestatistics.org/blog/index.php?pk=147163&T=2

[TABLE]
[ROW][C]Multiple Linear Regression - Ordinary Least Squares[/C][/ROW]
[ROW][C]Variable[/C][C]Parameter[/C][C]S.D.[/C][C]T-STATH0: parameter = 0[/C][C]2-tail p-value[/C][C]1-tail p-value[/C][/ROW]
[ROW][C](Intercept)[/C][C]3.79804983737547[/C][C]0.448437[/C][C]8.4695[/C][C]0[/C][C]0[/C][/ROW]
[ROW][C]gewicht[/C][C]0.0114890321966031[/C][C]0.001454[/C][C]7.8993[/C][C]0[/C][C]0[/C][/ROW]
[ROW][C]veldgoal[/C][C]1.1388895664414[/C][C]0.794921[/C][C]1.4327[/C][C]0.158291[/C][C]0.079145[/C][/ROW]
[ROW][C]vrijeworp[/C][C]-0.0493155495249556[/C][C]0.380348[/C][C]-0.1297[/C][C]0.897367[/C][C]0.448683[/C][/ROW]
[ROW][C]puntpergame[/C][C]-0.00827334697367462[/C][C]0.00666[/C][C]-1.2423[/C][C]0.220051[/C][C]0.110026[/C][/ROW]
[/TABLE]
Source: https://freestatistics.org/blog/index.php?pk=147163&T=2

Globally Unique Identifier (entire table): ba.freestatistics.org/blog/index.php?pk=147163&T=2

As an alternative you can also use a QR Code:  

The GUIDs for individual cells are displayed in the table below:

Multiple Linear Regression - Ordinary Least Squares
VariableParameterS.D.T-STATH0: parameter = 02-tail p-value1-tail p-value
(Intercept)3.798049837375470.4484378.469500
gewicht0.01148903219660310.0014547.899300
veldgoal1.13888956644140.7949211.43270.1582910.079145
vrijeworp-0.04931554952495560.380348-0.12970.8973670.448683
puntpergame-0.008273346973674620.00666-1.24230.2200510.110026


Multiple Linear Regression - Regression Statistics
Multiple R0.843716966762635
R-squared0.711858320003141
Adjusted R-squared0.68833655020748
F-TEST (value)30.2638077911309
F-TEST (DF numerator)4
F-TEST (DF denominator)49
p-value1.06203934535642e-12
Multiple Linear Regression - Residual Statistics
Residual Standard Deviation0.256185836033174
Sum Squared Residuals3.21592794661679

\begin{tabular}{lllllllll}
\hline
Multiple Linear Regression - Regression Statistics \tabularnewline
Multiple R & 0.843716966762635 \tabularnewline
R-squared & 0.711858320003141 \tabularnewline
Adjusted R-squared & 0.68833655020748 \tabularnewline
F-TEST (value) & 30.2638077911309 \tabularnewline
F-TEST (DF numerator) & 4 \tabularnewline
F-TEST (DF denominator) & 49 \tabularnewline
p-value & 1.06203934535642e-12 \tabularnewline
Multiple Linear Regression - Residual Statistics \tabularnewline
Residual Standard Deviation & 0.256185836033174 \tabularnewline
Sum Squared Residuals & 3.21592794661679 \tabularnewline
\hline
\end{tabular}
%Source: https://freestatistics.org/blog/index.php?pk=147163&T=3

[TABLE]
[ROW][C]Multiple Linear Regression - Regression Statistics[/C][/ROW]
[ROW][C]Multiple R[/C][C]0.843716966762635[/C][/ROW]
[ROW][C]R-squared[/C][C]0.711858320003141[/C][/ROW]
[ROW][C]Adjusted R-squared[/C][C]0.68833655020748[/C][/ROW]
[ROW][C]F-TEST (value)[/C][C]30.2638077911309[/C][/ROW]
[ROW][C]F-TEST (DF numerator)[/C][C]4[/C][/ROW]
[ROW][C]F-TEST (DF denominator)[/C][C]49[/C][/ROW]
[ROW][C]p-value[/C][C]1.06203934535642e-12[/C][/ROW]
[ROW][C]Multiple Linear Regression - Residual Statistics[/C][/ROW]
[ROW][C]Residual Standard Deviation[/C][C]0.256185836033174[/C][/ROW]
[ROW][C]Sum Squared Residuals[/C][C]3.21592794661679[/C][/ROW]
[/TABLE]
Source: https://freestatistics.org/blog/index.php?pk=147163&T=3

Globally Unique Identifier (entire table): ba.freestatistics.org/blog/index.php?pk=147163&T=3

As an alternative you can also use a QR Code:  

The GUIDs for individual cells are displayed in the table below:

Multiple Linear Regression - Regression Statistics
Multiple R0.843716966762635
R-squared0.711858320003141
Adjusted R-squared0.68833655020748
F-TEST (value)30.2638077911309
F-TEST (DF numerator)4
F-TEST (DF denominator)49
p-value1.06203934535642e-12
Multiple Linear Regression - Residual Statistics
Residual Standard Deviation0.256185836033174
Sum Squared Residuals3.21592794661679


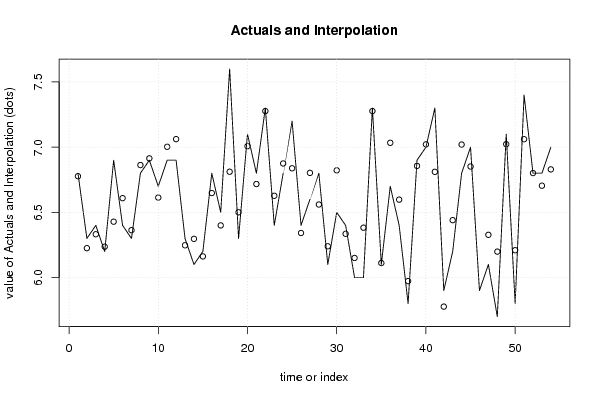
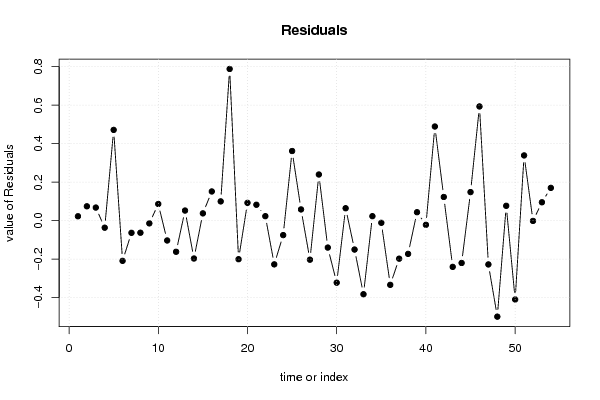
Multiple Linear Regression - Actuals, Interpolation, and Residuals
Time or IndexActualsInterpolationForecastResidualsPrediction Error
16.86.777216428539690.0227835714603127
26.36.225389941602650.0746100583973457
36.46.332051581654790.0679484183452135
46.26.2365984856893-0.0365984856893019
56.96.428337208649580.471662791350417
66.46.60878764903926-0.208787649039261
76.36.36319559706509-0.0631955970650903
86.86.8627513965157-0.0627513965157051
96.96.91416451469152-0.0141645146915233
106.76.613311425024970.0866885749750283
116.97.00306804035636-0.10306804035636
126.97.06171595334801-0.161715953348009
136.36.247486656496170.0525133435038309
146.16.29669442621608-0.19669442621608
156.26.162157437117250.0378425628827506
166.86.648267014624350.15173298537565
176.56.399855420787650.100144579212345
187.66.811648923556890.788351076443113
196.36.50037165329436-0.200371653294361
207.17.007336460462280.0926635395377213
216.86.717350708367020.0826492916329766
227.37.276740292957540.0232597070424619
236.46.62716862979572-0.227168629795722
246.86.87505529519688-0.0750552951968792
257.26.838085663475040.361914336524963
266.46.341640210672020.0583597893279758
276.66.8028011287696-0.202801128769602
286.86.560157894601650.239842105398347
296.16.23984804432862-0.139848044328621
306.56.82232627045329-0.322326270453292
316.46.33548449617170.0645155038282995
3266.15011945108905-0.150119451089046
3366.38236303276735-0.382363032767349
347.37.276740292957540.0232597070424619
356.16.11104785141792-0.0110478514179177
366.77.0335500727241-0.333550072724105
376.46.5974806689817-0.197480668981698
385.85.97276246233688-0.172762462336878
396.96.856102730907960.043897269092039
4077.02165825889132-0.0216582588913217
417.36.810782484759740.489217515240259
425.95.776947769182530.123052230817475
436.26.44015844681562-0.240158446815625
446.87.01991994842145-0.219919948421446
4576.851582368820050.148417631179946
465.95.306524385227790.593475614772211
476.16.32751520664154-0.227515206641542
485.76.198832904207-0.498832904207001
497.17.022830136993270.0771698630067342
505.86.2094750450265-0.409475045026501
517.47.060976194797480.339023805202517
526.86.8014858275243-0.00148582752430329
536.86.704481265710230.0955187342897736
5476.829598344277630.170401655722373

\begin{tabular}{lllllllll}
\hline
Multiple Linear Regression - Actuals, Interpolation, and Residuals \tabularnewline
Time or Index & Actuals & InterpolationForecast & ResidualsPrediction Error \tabularnewline
1 & 6.8 & 6.77721642853969 & 0.0227835714603127 \tabularnewline
2 & 6.3 & 6.22538994160265 & 0.0746100583973457 \tabularnewline
3 & 6.4 & 6.33205158165479 & 0.0679484183452135 \tabularnewline
4 & 6.2 & 6.2365984856893 & -0.0365984856893019 \tabularnewline
5 & 6.9 & 6.42833720864958 & 0.471662791350417 \tabularnewline
6 & 6.4 & 6.60878764903926 & -0.208787649039261 \tabularnewline
7 & 6.3 & 6.36319559706509 & -0.0631955970650903 \tabularnewline
8 & 6.8 & 6.8627513965157 & -0.0627513965157051 \tabularnewline
9 & 6.9 & 6.91416451469152 & -0.0141645146915233 \tabularnewline
10 & 6.7 & 6.61331142502497 & 0.0866885749750283 \tabularnewline
11 & 6.9 & 7.00306804035636 & -0.10306804035636 \tabularnewline
12 & 6.9 & 7.06171595334801 & -0.161715953348009 \tabularnewline
13 & 6.3 & 6.24748665649617 & 0.0525133435038309 \tabularnewline
14 & 6.1 & 6.29669442621608 & -0.19669442621608 \tabularnewline
15 & 6.2 & 6.16215743711725 & 0.0378425628827506 \tabularnewline
16 & 6.8 & 6.64826701462435 & 0.15173298537565 \tabularnewline
17 & 6.5 & 6.39985542078765 & 0.100144579212345 \tabularnewline
18 & 7.6 & 6.81164892355689 & 0.788351076443113 \tabularnewline
19 & 6.3 & 6.50037165329436 & -0.200371653294361 \tabularnewline
20 & 7.1 & 7.00733646046228 & 0.0926635395377213 \tabularnewline
21 & 6.8 & 6.71735070836702 & 0.0826492916329766 \tabularnewline
22 & 7.3 & 7.27674029295754 & 0.0232597070424619 \tabularnewline
23 & 6.4 & 6.62716862979572 & -0.227168629795722 \tabularnewline
24 & 6.8 & 6.87505529519688 & -0.0750552951968792 \tabularnewline
25 & 7.2 & 6.83808566347504 & 0.361914336524963 \tabularnewline
26 & 6.4 & 6.34164021067202 & 0.0583597893279758 \tabularnewline
27 & 6.6 & 6.8028011287696 & -0.202801128769602 \tabularnewline
28 & 6.8 & 6.56015789460165 & 0.239842105398347 \tabularnewline
29 & 6.1 & 6.23984804432862 & -0.139848044328621 \tabularnewline
30 & 6.5 & 6.82232627045329 & -0.322326270453292 \tabularnewline
31 & 6.4 & 6.3354844961717 & 0.0645155038282995 \tabularnewline
32 & 6 & 6.15011945108905 & -0.150119451089046 \tabularnewline
33 & 6 & 6.38236303276735 & -0.382363032767349 \tabularnewline
34 & 7.3 & 7.27674029295754 & 0.0232597070424619 \tabularnewline
35 & 6.1 & 6.11104785141792 & -0.0110478514179177 \tabularnewline
36 & 6.7 & 7.0335500727241 & -0.333550072724105 \tabularnewline
37 & 6.4 & 6.5974806689817 & -0.197480668981698 \tabularnewline
38 & 5.8 & 5.97276246233688 & -0.172762462336878 \tabularnewline
39 & 6.9 & 6.85610273090796 & 0.043897269092039 \tabularnewline
40 & 7 & 7.02165825889132 & -0.0216582588913217 \tabularnewline
41 & 7.3 & 6.81078248475974 & 0.489217515240259 \tabularnewline
42 & 5.9 & 5.77694776918253 & 0.123052230817475 \tabularnewline
43 & 6.2 & 6.44015844681562 & -0.240158446815625 \tabularnewline
44 & 6.8 & 7.01991994842145 & -0.219919948421446 \tabularnewline
45 & 7 & 6.85158236882005 & 0.148417631179946 \tabularnewline
46 & 5.9 & 5.30652438522779 & 0.593475614772211 \tabularnewline
47 & 6.1 & 6.32751520664154 & -0.227515206641542 \tabularnewline
48 & 5.7 & 6.198832904207 & -0.498832904207001 \tabularnewline
49 & 7.1 & 7.02283013699327 & 0.0771698630067342 \tabularnewline
50 & 5.8 & 6.2094750450265 & -0.409475045026501 \tabularnewline
51 & 7.4 & 7.06097619479748 & 0.339023805202517 \tabularnewline
52 & 6.8 & 6.8014858275243 & -0.00148582752430329 \tabularnewline
53 & 6.8 & 6.70448126571023 & 0.0955187342897736 \tabularnewline
54 & 7 & 6.82959834427763 & 0.170401655722373 \tabularnewline
\hline
\end{tabular}
%Source: https://freestatistics.org/blog/index.php?pk=147163&T=4

[TABLE]
[ROW][C]Multiple Linear Regression - Actuals, Interpolation, and Residuals[/C][/ROW]
[ROW][C]Time or Index[/C][C]Actuals[/C][C]InterpolationForecast[/C][C]ResidualsPrediction Error[/C][/ROW]
[ROW][C]1[/C][C]6.8[/C][C]6.77721642853969[/C][C]0.0227835714603127[/C][/ROW]
[ROW][C]2[/C][C]6.3[/C][C]6.22538994160265[/C][C]0.0746100583973457[/C][/ROW]
[ROW][C]3[/C][C]6.4[/C][C]6.33205158165479[/C][C]0.0679484183452135[/C][/ROW]
[ROW][C]4[/C][C]6.2[/C][C]6.2365984856893[/C][C]-0.0365984856893019[/C][/ROW]
[ROW][C]5[/C][C]6.9[/C][C]6.42833720864958[/C][C]0.471662791350417[/C][/ROW]
[ROW][C]6[/C][C]6.4[/C][C]6.60878764903926[/C][C]-0.208787649039261[/C][/ROW]
[ROW][C]7[/C][C]6.3[/C][C]6.36319559706509[/C][C]-0.0631955970650903[/C][/ROW]
[ROW][C]8[/C][C]6.8[/C][C]6.8627513965157[/C][C]-0.0627513965157051[/C][/ROW]
[ROW][C]9[/C][C]6.9[/C][C]6.91416451469152[/C][C]-0.0141645146915233[/C][/ROW]
[ROW][C]10[/C][C]6.7[/C][C]6.61331142502497[/C][C]0.0866885749750283[/C][/ROW]
[ROW][C]11[/C][C]6.9[/C][C]7.00306804035636[/C][C]-0.10306804035636[/C][/ROW]
[ROW][C]12[/C][C]6.9[/C][C]7.06171595334801[/C][C]-0.161715953348009[/C][/ROW]
[ROW][C]13[/C][C]6.3[/C][C]6.24748665649617[/C][C]0.0525133435038309[/C][/ROW]
[ROW][C]14[/C][C]6.1[/C][C]6.29669442621608[/C][C]-0.19669442621608[/C][/ROW]
[ROW][C]15[/C][C]6.2[/C][C]6.16215743711725[/C][C]0.0378425628827506[/C][/ROW]
[ROW][C]16[/C][C]6.8[/C][C]6.64826701462435[/C][C]0.15173298537565[/C][/ROW]
[ROW][C]17[/C][C]6.5[/C][C]6.39985542078765[/C][C]0.100144579212345[/C][/ROW]
[ROW][C]18[/C][C]7.6[/C][C]6.81164892355689[/C][C]0.788351076443113[/C][/ROW]
[ROW][C]19[/C][C]6.3[/C][C]6.50037165329436[/C][C]-0.200371653294361[/C][/ROW]
[ROW][C]20[/C][C]7.1[/C][C]7.00733646046228[/C][C]0.0926635395377213[/C][/ROW]
[ROW][C]21[/C][C]6.8[/C][C]6.71735070836702[/C][C]0.0826492916329766[/C][/ROW]
[ROW][C]22[/C][C]7.3[/C][C]7.27674029295754[/C][C]0.0232597070424619[/C][/ROW]
[ROW][C]23[/C][C]6.4[/C][C]6.62716862979572[/C][C]-0.227168629795722[/C][/ROW]
[ROW][C]24[/C][C]6.8[/C][C]6.87505529519688[/C][C]-0.0750552951968792[/C][/ROW]
[ROW][C]25[/C][C]7.2[/C][C]6.83808566347504[/C][C]0.361914336524963[/C][/ROW]
[ROW][C]26[/C][C]6.4[/C][C]6.34164021067202[/C][C]0.0583597893279758[/C][/ROW]
[ROW][C]27[/C][C]6.6[/C][C]6.8028011287696[/C][C]-0.202801128769602[/C][/ROW]
[ROW][C]28[/C][C]6.8[/C][C]6.56015789460165[/C][C]0.239842105398347[/C][/ROW]
[ROW][C]29[/C][C]6.1[/C][C]6.23984804432862[/C][C]-0.139848044328621[/C][/ROW]
[ROW][C]30[/C][C]6.5[/C][C]6.82232627045329[/C][C]-0.322326270453292[/C][/ROW]
[ROW][C]31[/C][C]6.4[/C][C]6.3354844961717[/C][C]0.0645155038282995[/C][/ROW]
[ROW][C]32[/C][C]6[/C][C]6.15011945108905[/C][C]-0.150119451089046[/C][/ROW]
[ROW][C]33[/C][C]6[/C][C]6.38236303276735[/C][C]-0.382363032767349[/C][/ROW]
[ROW][C]34[/C][C]7.3[/C][C]7.27674029295754[/C][C]0.0232597070424619[/C][/ROW]
[ROW][C]35[/C][C]6.1[/C][C]6.11104785141792[/C][C]-0.0110478514179177[/C][/ROW]
[ROW][C]36[/C][C]6.7[/C][C]7.0335500727241[/C][C]-0.333550072724105[/C][/ROW]
[ROW][C]37[/C][C]6.4[/C][C]6.5974806689817[/C][C]-0.197480668981698[/C][/ROW]
[ROW][C]38[/C][C]5.8[/C][C]5.97276246233688[/C][C]-0.172762462336878[/C][/ROW]
[ROW][C]39[/C][C]6.9[/C][C]6.85610273090796[/C][C]0.043897269092039[/C][/ROW]
[ROW][C]40[/C][C]7[/C][C]7.02165825889132[/C][C]-0.0216582588913217[/C][/ROW]
[ROW][C]41[/C][C]7.3[/C][C]6.81078248475974[/C][C]0.489217515240259[/C][/ROW]
[ROW][C]42[/C][C]5.9[/C][C]5.77694776918253[/C][C]0.123052230817475[/C][/ROW]
[ROW][C]43[/C][C]6.2[/C][C]6.44015844681562[/C][C]-0.240158446815625[/C][/ROW]
[ROW][C]44[/C][C]6.8[/C][C]7.01991994842145[/C][C]-0.219919948421446[/C][/ROW]
[ROW][C]45[/C][C]7[/C][C]6.85158236882005[/C][C]0.148417631179946[/C][/ROW]
[ROW][C]46[/C][C]5.9[/C][C]5.30652438522779[/C][C]0.593475614772211[/C][/ROW]
[ROW][C]47[/C][C]6.1[/C][C]6.32751520664154[/C][C]-0.227515206641542[/C][/ROW]
[ROW][C]48[/C][C]5.7[/C][C]6.198832904207[/C][C]-0.498832904207001[/C][/ROW]
[ROW][C]49[/C][C]7.1[/C][C]7.02283013699327[/C][C]0.0771698630067342[/C][/ROW]
[ROW][C]50[/C][C]5.8[/C][C]6.2094750450265[/C][C]-0.409475045026501[/C][/ROW]
[ROW][C]51[/C][C]7.4[/C][C]7.06097619479748[/C][C]0.339023805202517[/C][/ROW]
[ROW][C]52[/C][C]6.8[/C][C]6.8014858275243[/C][C]-0.00148582752430329[/C][/ROW]
[ROW][C]53[/C][C]6.8[/C][C]6.70448126571023[/C][C]0.0955187342897736[/C][/ROW]
[ROW][C]54[/C][C]7[/C][C]6.82959834427763[/C][C]0.170401655722373[/C][/ROW]
[/TABLE]
Source: https://freestatistics.org/blog/index.php?pk=147163&T=4

Globally Unique Identifier (entire table): ba.freestatistics.org/blog/index.php?pk=147163&T=4

As an alternative you can also use a QR Code:  

The GUIDs for individual cells are displayed in the table below:

Multiple Linear Regression - Actuals, Interpolation, and Residuals
Time or IndexActualsInterpolationForecastResidualsPrediction Error
16.86.777216428539690.0227835714603127
26.36.225389941602650.0746100583973457
36.46.332051581654790.0679484183452135
46.26.2365984856893-0.0365984856893019
56.96.428337208649580.471662791350417
66.46.60878764903926-0.208787649039261
76.36.36319559706509-0.0631955970650903
86.86.8627513965157-0.0627513965157051
96.96.91416451469152-0.0141645146915233
106.76.613311425024970.0866885749750283
116.97.00306804035636-0.10306804035636
126.97.06171595334801-0.161715953348009
136.36.247486656496170.0525133435038309
146.16.29669442621608-0.19669442621608
156.26.162157437117250.0378425628827506
166.86.648267014624350.15173298537565
176.56.399855420787650.100144579212345
187.66.811648923556890.788351076443113
196.36.50037165329436-0.200371653294361
207.17.007336460462280.0926635395377213
216.86.717350708367020.0826492916329766
227.37.276740292957540.0232597070424619
236.46.62716862979572-0.227168629795722
246.86.87505529519688-0.0750552951968792
257.26.838085663475040.361914336524963
266.46.341640210672020.0583597893279758
276.66.8028011287696-0.202801128769602
286.86.560157894601650.239842105398347
296.16.23984804432862-0.139848044328621
306.56.82232627045329-0.322326270453292
316.46.33548449617170.0645155038282995
3266.15011945108905-0.150119451089046
3366.38236303276735-0.382363032767349
347.37.276740292957540.0232597070424619
356.16.11104785141792-0.0110478514179177
366.77.0335500727241-0.333550072724105
376.46.5974806689817-0.197480668981698
385.85.97276246233688-0.172762462336878
396.96.856102730907960.043897269092039
4077.02165825889132-0.0216582588913217
417.36.810782484759740.489217515240259
425.95.776947769182530.123052230817475
436.26.44015844681562-0.240158446815625
446.87.01991994842145-0.219919948421446
4576.851582368820050.148417631179946
465.95.306524385227790.593475614772211
476.16.32751520664154-0.227515206641542
485.76.198832904207-0.498832904207001
497.17.022830136993270.0771698630067342
505.86.2094750450265-0.409475045026501
517.47.060976194797480.339023805202517
526.86.8014858275243-0.00148582752430329
536.86.704481265710230.0955187342897736
5476.829598344277630.170401655722373


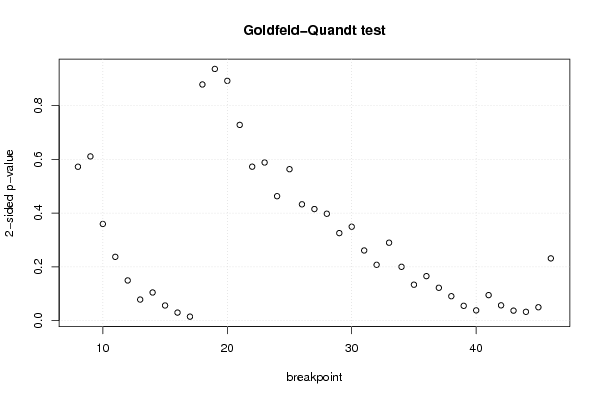
Goldfeld-Quandt test for Heteroskedasticity
p-valuesAlternative Hypothesis
breakpoint indexgreater2-sidedless
80.2860480751853970.5720961503707940.713951924814603
90.305235523300610.6104710466012190.69476447669939
100.1797432246189730.3594864492379460.820256775381027
110.1186286350687660.2372572701375310.881371364931234
120.07475212100937320.1495042420187460.925247878990627
130.0392248603729610.0784497207459220.96077513962704
140.05236614951635320.1047322990327060.947633850483647
150.02821077907872110.05642155815744230.97178922092128
160.0150334371616340.03006687432326810.984966562838366
170.007465951423655020.014931902847310.992534048576345
180.5610385888549050.877922822290190.438961411145095
190.5321561362061850.935687727587630.467843863793815
200.4457160430441950.891432086088390.554283956955805
210.3638802770217740.7277605540435480.636119722978226
220.2861667732279470.5723335464558940.713833226772053
230.2939742043668660.5879484087337320.706025795633134
240.2313608954273480.4627217908546960.768639104572652
250.2815190877999590.5630381755999180.718480912200041
260.2163075540534640.4326151081069270.783692445946536
270.2074394202698250.4148788405396510.792560579730175
280.1987193244887440.3974386489774880.801280675511256
290.1627388451958960.3254776903917920.837261154804104
300.1745954567548820.3491909135097650.825404543245118
310.1304580614252410.2609161228504830.869541938574759
320.1038338981310140.2076677962620280.896166101868986
330.1448534277241980.2897068554483960.855146572275802
340.1001285468282630.2002570936565270.899871453171737
350.0668080426631040.1336160853262080.933191957336896
360.08276405601193610.1655281120238720.917235943988064
370.06113250553831980.122265011076640.93886749446168
380.04543852164819360.09087704329638730.954561478351806
390.02759242306040140.05518484612080290.972407576939599
400.01909565553407280.03819131106814560.980904344465927
410.04746930621481070.09493861242962130.95253069378519
420.0284928049442220.05698560988844410.971507195055778
430.0186167266217520.0372334532435040.981383273378248
440.0164229546098590.03284590921971810.98357704539014
450.02493986502601140.04987973005202270.975060134973989
460.8842212743598270.2315574512803460.115778725640173

\begin{tabular}{lllllllll}
\hline
Goldfeld-Quandt test for Heteroskedasticity \tabularnewline
p-values & Alternative Hypothesis \tabularnewline
breakpoint index & greater & 2-sided & less \tabularnewline
8 & 0.286048075185397 & 0.572096150370794 & 0.713951924814603 \tabularnewline
9 & 0.30523552330061 & 0.610471046601219 & 0.69476447669939 \tabularnewline
10 & 0.179743224618973 & 0.359486449237946 & 0.820256775381027 \tabularnewline
11 & 0.118628635068766 & 0.237257270137531 & 0.881371364931234 \tabularnewline
12 & 0.0747521210093732 & 0.149504242018746 & 0.925247878990627 \tabularnewline
13 & 0.039224860372961 & 0.078449720745922 & 0.96077513962704 \tabularnewline
14 & 0.0523661495163532 & 0.104732299032706 & 0.947633850483647 \tabularnewline
15 & 0.0282107790787211 & 0.0564215581574423 & 0.97178922092128 \tabularnewline
16 & 0.015033437161634 & 0.0300668743232681 & 0.984966562838366 \tabularnewline
17 & 0.00746595142365502 & 0.01493190284731 & 0.992534048576345 \tabularnewline
18 & 0.561038588854905 & 0.87792282229019 & 0.438961411145095 \tabularnewline
19 & 0.532156136206185 & 0.93568772758763 & 0.467843863793815 \tabularnewline
20 & 0.445716043044195 & 0.89143208608839 & 0.554283956955805 \tabularnewline
21 & 0.363880277021774 & 0.727760554043548 & 0.636119722978226 \tabularnewline
22 & 0.286166773227947 & 0.572333546455894 & 0.713833226772053 \tabularnewline
23 & 0.293974204366866 & 0.587948408733732 & 0.706025795633134 \tabularnewline
24 & 0.231360895427348 & 0.462721790854696 & 0.768639104572652 \tabularnewline
25 & 0.281519087799959 & 0.563038175599918 & 0.718480912200041 \tabularnewline
26 & 0.216307554053464 & 0.432615108106927 & 0.783692445946536 \tabularnewline
27 & 0.207439420269825 & 0.414878840539651 & 0.792560579730175 \tabularnewline
28 & 0.198719324488744 & 0.397438648977488 & 0.801280675511256 \tabularnewline
29 & 0.162738845195896 & 0.325477690391792 & 0.837261154804104 \tabularnewline
30 & 0.174595456754882 & 0.349190913509765 & 0.825404543245118 \tabularnewline
31 & 0.130458061425241 & 0.260916122850483 & 0.869541938574759 \tabularnewline
32 & 0.103833898131014 & 0.207667796262028 & 0.896166101868986 \tabularnewline
33 & 0.144853427724198 & 0.289706855448396 & 0.855146572275802 \tabularnewline
34 & 0.100128546828263 & 0.200257093656527 & 0.899871453171737 \tabularnewline
35 & 0.066808042663104 & 0.133616085326208 & 0.933191957336896 \tabularnewline
36 & 0.0827640560119361 & 0.165528112023872 & 0.917235943988064 \tabularnewline
37 & 0.0611325055383198 & 0.12226501107664 & 0.93886749446168 \tabularnewline
38 & 0.0454385216481936 & 0.0908770432963873 & 0.954561478351806 \tabularnewline
39 & 0.0275924230604014 & 0.0551848461208029 & 0.972407576939599 \tabularnewline
40 & 0.0190956555340728 & 0.0381913110681456 & 0.980904344465927 \tabularnewline
41 & 0.0474693062148107 & 0.0949386124296213 & 0.95253069378519 \tabularnewline
42 & 0.028492804944222 & 0.0569856098884441 & 0.971507195055778 \tabularnewline
43 & 0.018616726621752 & 0.037233453243504 & 0.981383273378248 \tabularnewline
44 & 0.016422954609859 & 0.0328459092197181 & 0.98357704539014 \tabularnewline
45 & 0.0249398650260114 & 0.0498797300520227 & 0.975060134973989 \tabularnewline
46 & 0.884221274359827 & 0.231557451280346 & 0.115778725640173 \tabularnewline
\hline
\end{tabular}
%Source: https://freestatistics.org/blog/index.php?pk=147163&T=5

[TABLE]
[ROW][C]Goldfeld-Quandt test for Heteroskedasticity[/C][/ROW]
[ROW][C]p-values[/C][C]Alternative Hypothesis[/C][/ROW]
[ROW][C]breakpoint index[/C][C]greater[/C][C]2-sided[/C][C]less[/C][/ROW]
[ROW][C]8[/C][C]0.286048075185397[/C][C]0.572096150370794[/C][C]0.713951924814603[/C][/ROW]
[ROW][C]9[/C][C]0.30523552330061[/C][C]0.610471046601219[/C][C]0.69476447669939[/C][/ROW]
[ROW][C]10[/C][C]0.179743224618973[/C][C]0.359486449237946[/C][C]0.820256775381027[/C][/ROW]
[ROW][C]11[/C][C]0.118628635068766[/C][C]0.237257270137531[/C][C]0.881371364931234[/C][/ROW]
[ROW][C]12[/C][C]0.0747521210093732[/C][C]0.149504242018746[/C][C]0.925247878990627[/C][/ROW]
[ROW][C]13[/C][C]0.039224860372961[/C][C]0.078449720745922[/C][C]0.96077513962704[/C][/ROW]
[ROW][C]14[/C][C]0.0523661495163532[/C][C]0.104732299032706[/C][C]0.947633850483647[/C][/ROW]
[ROW][C]15[/C][C]0.0282107790787211[/C][C]0.0564215581574423[/C][C]0.97178922092128[/C][/ROW]
[ROW][C]16[/C][C]0.015033437161634[/C][C]0.0300668743232681[/C][C]0.984966562838366[/C][/ROW]
[ROW][C]17[/C][C]0.00746595142365502[/C][C]0.01493190284731[/C][C]0.992534048576345[/C][/ROW]
[ROW][C]18[/C][C]0.561038588854905[/C][C]0.87792282229019[/C][C]0.438961411145095[/C][/ROW]
[ROW][C]19[/C][C]0.532156136206185[/C][C]0.93568772758763[/C][C]0.467843863793815[/C][/ROW]
[ROW][C]20[/C][C]0.445716043044195[/C][C]0.89143208608839[/C][C]0.554283956955805[/C][/ROW]
[ROW][C]21[/C][C]0.363880277021774[/C][C]0.727760554043548[/C][C]0.636119722978226[/C][/ROW]
[ROW][C]22[/C][C]0.286166773227947[/C][C]0.572333546455894[/C][C]0.713833226772053[/C][/ROW]
[ROW][C]23[/C][C]0.293974204366866[/C][C]0.587948408733732[/C][C]0.706025795633134[/C][/ROW]
[ROW][C]24[/C][C]0.231360895427348[/C][C]0.462721790854696[/C][C]0.768639104572652[/C][/ROW]
[ROW][C]25[/C][C]0.281519087799959[/C][C]0.563038175599918[/C][C]0.718480912200041[/C][/ROW]
[ROW][C]26[/C][C]0.216307554053464[/C][C]0.432615108106927[/C][C]0.783692445946536[/C][/ROW]
[ROW][C]27[/C][C]0.207439420269825[/C][C]0.414878840539651[/C][C]0.792560579730175[/C][/ROW]
[ROW][C]28[/C][C]0.198719324488744[/C][C]0.397438648977488[/C][C]0.801280675511256[/C][/ROW]
[ROW][C]29[/C][C]0.162738845195896[/C][C]0.325477690391792[/C][C]0.837261154804104[/C][/ROW]
[ROW][C]30[/C][C]0.174595456754882[/C][C]0.349190913509765[/C][C]0.825404543245118[/C][/ROW]
[ROW][C]31[/C][C]0.130458061425241[/C][C]0.260916122850483[/C][C]0.869541938574759[/C][/ROW]
[ROW][C]32[/C][C]0.103833898131014[/C][C]0.207667796262028[/C][C]0.896166101868986[/C][/ROW]
[ROW][C]33[/C][C]0.144853427724198[/C][C]0.289706855448396[/C][C]0.855146572275802[/C][/ROW]
[ROW][C]34[/C][C]0.100128546828263[/C][C]0.200257093656527[/C][C]0.899871453171737[/C][/ROW]
[ROW][C]35[/C][C]0.066808042663104[/C][C]0.133616085326208[/C][C]0.933191957336896[/C][/ROW]
[ROW][C]36[/C][C]0.0827640560119361[/C][C]0.165528112023872[/C][C]0.917235943988064[/C][/ROW]
[ROW][C]37[/C][C]0.0611325055383198[/C][C]0.12226501107664[/C][C]0.93886749446168[/C][/ROW]
[ROW][C]38[/C][C]0.0454385216481936[/C][C]0.0908770432963873[/C][C]0.954561478351806[/C][/ROW]
[ROW][C]39[/C][C]0.0275924230604014[/C][C]0.0551848461208029[/C][C]0.972407576939599[/C][/ROW]
[ROW][C]40[/C][C]0.0190956555340728[/C][C]0.0381913110681456[/C][C]0.980904344465927[/C][/ROW]
[ROW][C]41[/C][C]0.0474693062148107[/C][C]0.0949386124296213[/C][C]0.95253069378519[/C][/ROW]
[ROW][C]42[/C][C]0.028492804944222[/C][C]0.0569856098884441[/C][C]0.971507195055778[/C][/ROW]
[ROW][C]43[/C][C]0.018616726621752[/C][C]0.037233453243504[/C][C]0.981383273378248[/C][/ROW]
[ROW][C]44[/C][C]0.016422954609859[/C][C]0.0328459092197181[/C][C]0.98357704539014[/C][/ROW]
[ROW][C]45[/C][C]0.0249398650260114[/C][C]0.0498797300520227[/C][C]0.975060134973989[/C][/ROW]
[ROW][C]46[/C][C]0.884221274359827[/C][C]0.231557451280346[/C][C]0.115778725640173[/C][/ROW]
[/TABLE]
Source: https://freestatistics.org/blog/index.php?pk=147163&T=5

Globally Unique Identifier (entire table): ba.freestatistics.org/blog/index.php?pk=147163&T=5

As an alternative you can also use a QR Code:  

The GUIDs for individual cells are displayed in the table below:

Goldfeld-Quandt test for Heteroskedasticity
p-valuesAlternative Hypothesis
breakpoint indexgreater2-sidedless
80.2860480751853970.5720961503707940.713951924814603
90.305235523300610.6104710466012190.69476447669939
100.1797432246189730.3594864492379460.820256775381027
110.1186286350687660.2372572701375310.881371364931234
120.07475212100937320.1495042420187460.925247878990627
130.0392248603729610.0784497207459220.96077513962704
140.05236614951635320.1047322990327060.947633850483647
150.02821077907872110.05642155815744230.97178922092128
160.0150334371616340.03006687432326810.984966562838366
170.007465951423655020.014931902847310.992534048576345
180.5610385888549050.877922822290190.438961411145095
190.5321561362061850.935687727587630.467843863793815
200.4457160430441950.891432086088390.554283956955805
210.3638802770217740.7277605540435480.636119722978226
220.2861667732279470.5723335464558940.713833226772053
230.2939742043668660.5879484087337320.706025795633134
240.2313608954273480.4627217908546960.768639104572652
250.2815190877999590.5630381755999180.718480912200041
260.2163075540534640.4326151081069270.783692445946536
270.2074394202698250.4148788405396510.792560579730175
280.1987193244887440.3974386489774880.801280675511256
290.1627388451958960.3254776903917920.837261154804104
300.1745954567548820.3491909135097650.825404543245118
310.1304580614252410.2609161228504830.869541938574759
320.1038338981310140.2076677962620280.896166101868986
330.1448534277241980.2897068554483960.855146572275802
340.1001285468282630.2002570936565270.899871453171737
350.0668080426631040.1336160853262080.933191957336896
360.08276405601193610.1655281120238720.917235943988064
370.06113250553831980.122265011076640.93886749446168
380.04543852164819360.09087704329638730.954561478351806
390.02759242306040140.05518484612080290.972407576939599
400.01909565553407280.03819131106814560.980904344465927
410.04746930621481070.09493861242962130.95253069378519
420.0284928049442220.05698560988844410.971507195055778
430.0186167266217520.0372334532435040.981383273378248
440.0164229546098590.03284590921971810.98357704539014
450.02493986502601140.04987973005202270.975060134973989
460.8842212743598270.2315574512803460.115778725640173


Meta Analysis of Goldfeld-Quandt test for Heteroskedasticity
Description# significant tests% significant testsOK/NOK
1% type I error level00OK
5% type I error level60.153846153846154NOK
10% type I error level120.307692307692308NOK

\begin{tabular}{lllllllll}
\hline
Meta Analysis of Goldfeld-Quandt test for Heteroskedasticity \tabularnewline
Description & # significant tests & % significant tests & OK/NOK \tabularnewline
1% type I error level & 0 & 0 & OK \tabularnewline
5% type I error level & 6 & 0.153846153846154 & NOK \tabularnewline
10% type I error level & 12 & 0.307692307692308 & NOK \tabularnewline
\hline
\end{tabular}
%Source: https://freestatistics.org/blog/index.php?pk=147163&T=6

[TABLE]
[ROW][C]Meta Analysis of Goldfeld-Quandt test for Heteroskedasticity[/C][/ROW]
[ROW][C]Description[/C][C]# significant tests[/C][C]% significant tests[/C][C]OK/NOK[/C][/ROW]
[ROW][C]1% type I error level[/C][C]0[/C][C]0[/C][C]OK[/C][/ROW]
[ROW][C]5% type I error level[/C][C]6[/C][C]0.153846153846154[/C][C]NOK[/C][/ROW]
[ROW][C]10% type I error level[/C][C]12[/C][C]0.307692307692308[/C][C]NOK[/C][/ROW]
[/TABLE]
Source: https://freestatistics.org/blog/index.php?pk=147163&T=6

Globally Unique Identifier (entire table): ba.freestatistics.org/blog/index.php?pk=147163&T=6

As an alternative you can also use a QR Code:  

The GUIDs for individual cells are displayed in the table below:

Meta Analysis of Goldfeld-Quandt test for Heteroskedasticity
Description# significant tests% significant testsOK/NOK
1% type I error level00OK
5% type I error level60.153846153846154NOK
10% type I error level120.307692307692308NOK


Parameters (Session):
par1 = 1 ; par2 = Do not include Seasonal Dummies ; par3 = No Linear Trend ;
Parameters (R input):
par1 = 1 ; par2 = Do not include Seasonal Dummies ; par3 = No Linear Trend ;
R code (references can be found in the software module):
library(lattice)
library(lmtest)
n25 <- 25 #minimum number of obs. for Goldfeld-Quandt test
par1 <- as.numeric(par1)
x <- t(y)
k <- length(x[1,])
n <- length(x[,1])
x1 <- cbind(x[,par1], x[,1:k!=par1])
mycolnames <- c(colnames(x)[par1], colnames(x)[1:k!=par1])
colnames(x1) <- mycolnames #colnames(x)[par1]
x <- x1
if (par3 == 'First Differences'){
x2 <- array(0, dim=c(n-1,k), dimnames=list(1:(n-1), paste('(1-B)',colnames(x),sep='')))
for (i in 1:n-1) {
for (j in 1:k) {
x2[i,j] <- x[i+1,j] - x[i,j]
}
}
x <- x2
}
if (par2 == 'Include Monthly Dummies'){
x2 <- array(0, dim=c(n,11), dimnames=list(1:n, paste('M', seq(1:11), sep ='')))
for (i in 1:11){
x2[seq(i,n,12),i] <- 1
}
x <- cbind(x, x2)
}
if (par2 == 'Include Quarterly Dummies'){
x2 <- array(0, dim=c(n,3), dimnames=list(1:n, paste('Q', seq(1:3), sep ='')))
for (i in 1:3){
x2[seq(i,n,4),i] <- 1
}
x <- cbind(x, x2)
}
k <- length(x[1,])
if (par3 == 'Linear Trend'){
x <- cbind(x, c(1:n))
colnames(x)[k+1] <- 't'
}
x
k <- length(x[1,])
df <- as.data.frame(x)
(mylm <- lm(df))
(mysum <- summary(mylm))
if (n > n25) {
kp3 <- k + 3
nmkm3 <- n - k - 3
gqarr <- array(NA, dim=c(nmkm3-kp3+1,3))
numgqtests <- 0
numsignificant1 <- 0
numsignificant5 <- 0
numsignificant10 <- 0
for (mypoint in kp3:nmkm3) {
j <- 0
numgqtests <- numgqtests + 1
for (myalt in c('greater', 'two.sided', 'less')) {
j <- j + 1
gqarr[mypoint-kp3+1,j] <- gqtest(mylm, point=mypoint, alternative=myalt)$p.value
}
if (gqarr[mypoint-kp3+1,2] < 0.01) numsignificant1 <- numsignificant1 + 1
if (gqarr[mypoint-kp3+1,2] < 0.05) numsignificant5 <- numsignificant5 + 1
if (gqarr[mypoint-kp3+1,2] < 0.10) numsignificant10 <- numsignificant10 + 1
}
gqarr
}
bitmap(file='test0.png')
plot(x[,1], type='l', main='Actuals and Interpolation', ylab='value of Actuals and Interpolation (dots)', xlab='time or index')
points(x[,1]-mysum$resid)
grid()
dev.off()
bitmap(file='test1.png')
plot(mysum$resid, type='b', pch=19, main='Residuals', ylab='value of Residuals', xlab='time or index')
grid()
dev.off()
bitmap(file='test2.png')
hist(mysum$resid, main='Residual Histogram', xlab='values of Residuals')
grid()
dev.off()
bitmap(file='test3.png')
densityplot(~mysum$resid,col='black',main='Residual Density Plot', xlab='values of Residuals')
dev.off()
bitmap(file='test4.png')
qqnorm(mysum$resid, main='Residual Normal Q-Q Plot')
qqline(mysum$resid)
grid()
dev.off()
(myerror <- as.ts(mysum$resid))
bitmap(file='test5.png')
dum <- cbind(lag(myerror,k=1),myerror)
dum
dum1 <- dum[2:length(myerror),]
dum1
z <- as.data.frame(dum1)
z
plot(z,main=paste('Residual Lag plot, lowess, and regression line'), ylab='values of Residuals', xlab='lagged values of Residuals')
lines(lowess(z))
abline(lm(z))
grid()
dev.off()
bitmap(file='test6.png')
acf(mysum$resid, lag.max=length(mysum$resid)/2, main='Residual Autocorrelation Function')
grid()
dev.off()
bitmap(file='test7.png')
pacf(mysum$resid, lag.max=length(mysum$resid)/2, main='Residual Partial Autocorrelation Function')
grid()
dev.off()
bitmap(file='test8.png')
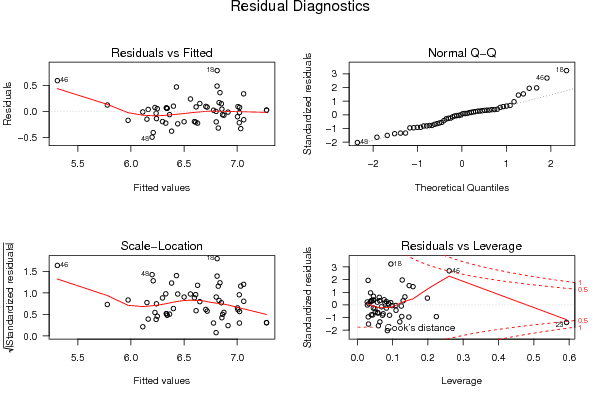
opar <- par(mfrow = c(2,2), oma = c(0, 0, 1.1, 0))
plot(mylm, las = 1, sub='Residual Diagnostics')
par(opar)
dev.off()
if (n > n25) {
bitmap(file='test9.png')
plot(kp3:nmkm3,gqarr[,2], main='Goldfeld-Quandt test',ylab='2-sided p-value',xlab='breakpoint')
grid()
dev.off()
}
load(file='createtable')
a<-table.start()
a<-table.row.start(a)
a<-table.element(a, 'Multiple Linear Regression - Estimated Regression Equation', 1, TRUE)
a<-table.row.end(a)
myeq <- colnames(x)[1]
myeq <- paste(myeq, '[t] = ', sep='')
for (i in 1:k){
if (mysum$coefficients[i,1] > 0) myeq <- paste(myeq, '+', '')
myeq <- paste(myeq, mysum$coefficients[i,1], sep=' ')
if (rownames(mysum$coefficients)[i] != '(Intercept)') {
myeq <- paste(myeq, rownames(mysum$coefficients)[i], sep='')
if (rownames(mysum$coefficients)[i] != 't') myeq <- paste(myeq, '[t]', sep='')
}
}
myeq <- paste(myeq, ' + e[t]')
a<-table.row.start(a)
a<-table.element(a, myeq)
a<-table.row.end(a)
a<-table.end(a)
table.save(a,file='mytable1.tab')
a<-table.start()
a<-table.row.start(a)
a<-table.element(a,hyperlink('ols1.htm','Multiple Linear Regression - Ordinary Least Squares',''), 6, TRUE)
a<-table.row.end(a)
a<-table.row.start(a)
a<-table.element(a,'Variable',header=TRUE)
a<-table.element(a,'Parameter',header=TRUE)
a<-table.element(a,'S.D.',header=TRUE)
a<-table.element(a,'T-STAT
H0: parameter = 0',header=TRUE)
a<-table.element(a,'2-tail p-value',header=TRUE)
a<-table.element(a,'1-tail p-value',header=TRUE)
a<-table.row.end(a)
for (i in 1:k){
a<-table.row.start(a)
a<-table.element(a,rownames(mysum$coefficients)[i],header=TRUE)
a<-table.element(a,mysum$coefficients[i,1])
a<-table.element(a, round(mysum$coefficients[i,2],6))
a<-table.element(a, round(mysum$coefficients[i,3],4))
a<-table.element(a, round(mysum$coefficients[i,4],6))
a<-table.element(a, round(mysum$coefficients[i,4]/2,6))
a<-table.row.end(a)
}
a<-table.end(a)
table.save(a,file='mytable2.tab')
a<-table.start()
a<-table.row.start(a)
a<-table.element(a, 'Multiple Linear Regression - Regression Statistics', 2, TRUE)
a<-table.row.end(a)
a<-table.row.start(a)
a<-table.element(a, 'Multiple R',1,TRUE)
a<-table.element(a, sqrt(mysum$r.squared))
a<-table.row.end(a)
a<-table.row.start(a)
a<-table.element(a, 'R-squared',1,TRUE)
a<-table.element(a, mysum$r.squared)
a<-table.row.end(a)
a<-table.row.start(a)
a<-table.element(a, 'Adjusted R-squared',1,TRUE)
a<-table.element(a, mysum$adj.r.squared)
a<-table.row.end(a)
a<-table.row.start(a)
a<-table.element(a, 'F-TEST (value)',1,TRUE)
a<-table.element(a, mysum$fstatistic[1])
a<-table.row.end(a)
a<-table.row.start(a)
a<-table.element(a, 'F-TEST (DF numerator)',1,TRUE)
a<-table.element(a, mysum$fstatistic[2])
a<-table.row.end(a)
a<-table.row.start(a)
a<-table.element(a, 'F-TEST (DF denominator)',1,TRUE)
a<-table.element(a, mysum$fstatistic[3])
a<-table.row.end(a)
a<-table.row.start(a)
a<-table.element(a, 'p-value',1,TRUE)
a<-table.element(a, 1-pf(mysum$fstatistic[1],mysum$fstatistic[2],mysum$fstatistic[3]))
a<-table.row.end(a)
a<-table.row.start(a)
a<-table.element(a, 'Multiple Linear Regression - Residual Statistics', 2, TRUE)
a<-table.row.end(a)
a<-table.row.start(a)
a<-table.element(a, 'Residual Standard Deviation',1,TRUE)
a<-table.element(a, mysum$sigma)
a<-table.row.end(a)
a<-table.row.start(a)
a<-table.element(a, 'Sum Squared Residuals',1,TRUE)
a<-table.element(a, sum(myerror*myerror))
a<-table.row.end(a)
a<-table.end(a)
table.save(a,file='mytable3.tab')
a<-table.start()
a<-table.row.start(a)
a<-table.element(a, 'Multiple Linear Regression - Actuals, Interpolation, and Residuals', 4, TRUE)
a<-table.row.end(a)
a<-table.row.start(a)
a<-table.element(a, 'Time or Index', 1, TRUE)
a<-table.element(a, 'Actuals', 1, TRUE)
a<-table.element(a, 'Interpolation
Forecast', 1, TRUE)
a<-table.element(a, 'Residuals
Prediction Error', 1, TRUE)
a<-table.row.end(a)
for (i in 1:n) {
a<-table.row.start(a)
a<-table.element(a,i, 1, TRUE)
a<-table.element(a,x[i])
a<-table.element(a,x[i]-mysum$resid[i])
a<-table.element(a,mysum$resid[i])
a<-table.row.end(a)
}
a<-table.end(a)
table.save(a,file='mytable4.tab')
if (n > n25) {
a<-table.start()
a<-table.row.start(a)
a<-table.element(a,'Goldfeld-Quandt test for Heteroskedasticity',4,TRUE)
a<-table.row.end(a)
a<-table.row.start(a)
a<-table.element(a,'p-values',header=TRUE)
a<-table.element(a,'Alternative Hypothesis',3,header=TRUE)
a<-table.row.end(a)
a<-table.row.start(a)
a<-table.element(a,'breakpoint index',header=TRUE)
a<-table.element(a,'greater',header=TRUE)
a<-table.element(a,'2-sided',header=TRUE)
a<-table.element(a,'less',header=TRUE)
a<-table.row.end(a)
for (mypoint in kp3:nmkm3) {
a<-table.row.start(a)
a<-table.element(a,mypoint,header=TRUE)
a<-table.element(a,gqarr[mypoint-kp3+1,1])
a<-table.element(a,gqarr[mypoint-kp3+1,2])
a<-table.element(a,gqarr[mypoint-kp3+1,3])
a<-table.row.end(a)
}
a<-table.end(a)
table.save(a,file='mytable5.tab')
a<-table.start()
a<-table.row.start(a)
a<-table.element(a,'Meta Analysis of Goldfeld-Quandt test for Heteroskedasticity',4,TRUE)
a<-table.row.end(a)
a<-table.row.start(a)
a<-table.element(a,'Description',header=TRUE)
a<-table.element(a,'# significant tests',header=TRUE)
a<-table.element(a,'% significant tests',header=TRUE)
a<-table.element(a,'OK/NOK',header=TRUE)
a<-table.row.end(a)
a<-table.row.start(a)
a<-table.element(a,'1% type I error level',header=TRUE)
a<-table.element(a,numsignificant1)
a<-table.element(a,numsignificant1/numgqtests)
if (numsignificant1/numgqtests < 0.01) dum <- 'OK' else dum <- 'NOK'
a<-table.element(a,dum)
a<-table.row.end(a)
a<-table.row.start(a)
a<-table.element(a,'5% type I error level',header=TRUE)
a<-table.element(a,numsignificant5)
a<-table.element(a,numsignificant5/numgqtests)
if (numsignificant5/numgqtests < 0.05) dum <- 'OK' else dum <- 'NOK'
a<-table.element(a,dum)
a<-table.row.end(a)
a<-table.row.start(a)
a<-table.element(a,'10% type I error level',header=TRUE)
a<-table.element(a,numsignificant10)
a<-table.element(a,numsignificant10/numgqtests)
if (numsignificant10/numgqtests < 0.1) dum <- 'OK' else dum <- 'NOK'
a<-table.element(a,dum)
a<-table.row.end(a)
a<-table.end(a)
table.save(a,file='mytable6.tab')
}