| Multiple Linear Regression - Estimated Regression Equation |
| hoogte[t] = + 3.79804983737547 + 0.0114890321966031gewicht[t] + 1.1388895664414veldgoal[t] -0.0493155495249556vrijeworp[t] -0.00827334697367462puntpergame[t] + e[t] |
| Multiple Linear Regression - Ordinary Least Squares | |||||
| Variable | Parameter | S.D. | T-STAT H0: parameter = 0 | 2-tail p-value | 1-tail p-value |
| (Intercept) | 3.79804983737547 | 0.448437 | 8.4695 | 0 | 0 |
| gewicht | 0.0114890321966031 | 0.001454 | 7.8993 | 0 | 0 |
| veldgoal | 1.1388895664414 | 0.794921 | 1.4327 | 0.158291 | 0.079145 |
| vrijeworp | -0.0493155495249556 | 0.380348 | -0.1297 | 0.897367 | 0.448683 |
| puntpergame | -0.00827334697367462 | 0.00666 | -1.2423 | 0.220051 | 0.110026 |
| Multiple Linear Regression - Regression Statistics | |
| Multiple R | 0.843716966762635 |
| R-squared | 0.711858320003141 |
| Adjusted R-squared | 0.68833655020748 |
| F-TEST (value) | 30.2638077911309 |
| F-TEST (DF numerator) | 4 |
| F-TEST (DF denominator) | 49 |
| p-value | 1.06203934535642e-12 |
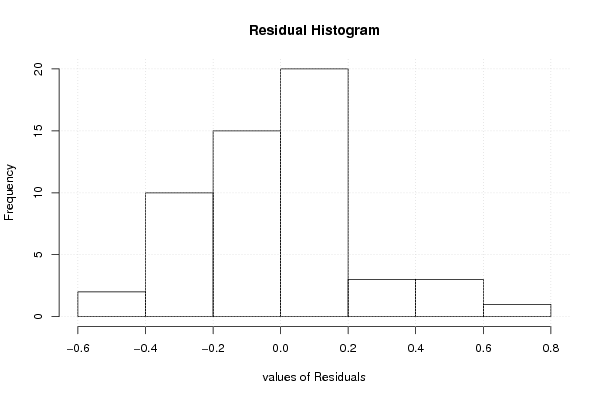
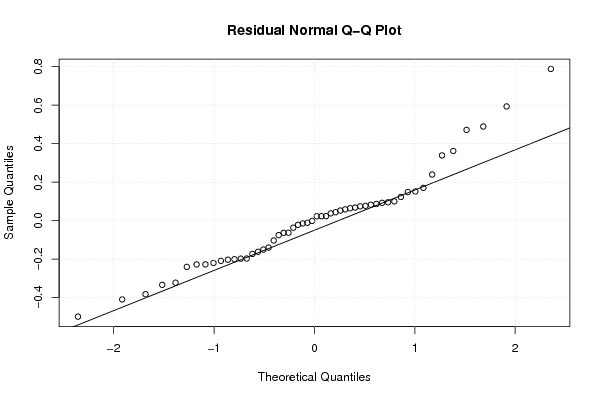
| Multiple Linear Regression - Residual Statistics | |
| Residual Standard Deviation | 0.256185836033174 |
| Sum Squared Residuals | 3.21592794661679 |
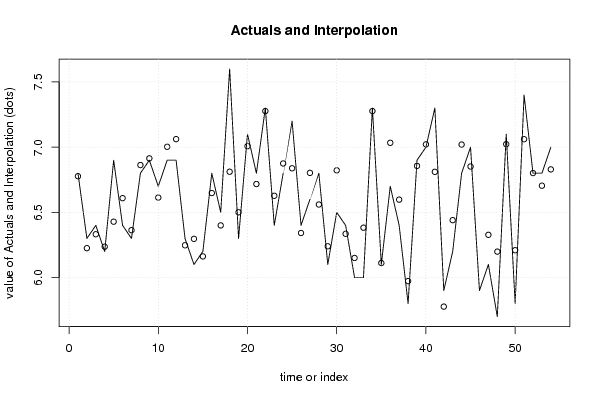
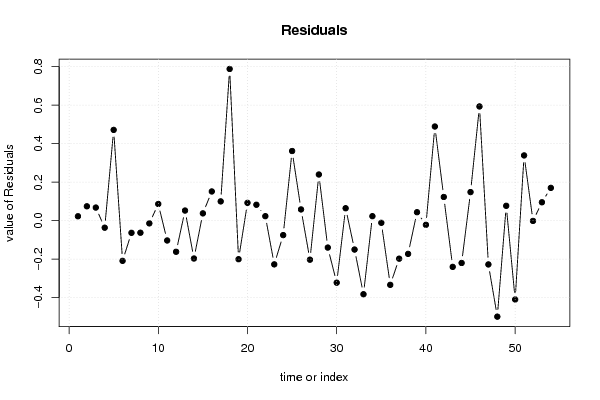
| Multiple Linear Regression - Actuals, Interpolation, and Residuals | |||
| Time or Index | Actuals | Interpolation Forecast | Residuals Prediction Error |
| 1 | 6.8 | 6.77721642853969 | 0.0227835714603127 |
| 2 | 6.3 | 6.22538994160265 | 0.0746100583973457 |
| 3 | 6.4 | 6.33205158165479 | 0.0679484183452135 |
| 4 | 6.2 | 6.2365984856893 | -0.0365984856893019 |
| 5 | 6.9 | 6.42833720864958 | 0.471662791350417 |
| 6 | 6.4 | 6.60878764903926 | -0.208787649039261 |
| 7 | 6.3 | 6.36319559706509 | -0.0631955970650903 |
| 8 | 6.8 | 6.8627513965157 | -0.0627513965157051 |
| 9 | 6.9 | 6.91416451469152 | -0.0141645146915233 |
| 10 | 6.7 | 6.61331142502497 | 0.0866885749750283 |
| 11 | 6.9 | 7.00306804035636 | -0.10306804035636 |
| 12 | 6.9 | 7.06171595334801 | -0.161715953348009 |
| 13 | 6.3 | 6.24748665649617 | 0.0525133435038309 |
| 14 | 6.1 | 6.29669442621608 | -0.19669442621608 |
| 15 | 6.2 | 6.16215743711725 | 0.0378425628827506 |
| 16 | 6.8 | 6.64826701462435 | 0.15173298537565 |
| 17 | 6.5 | 6.39985542078765 | 0.100144579212345 |
| 18 | 7.6 | 6.81164892355689 | 0.788351076443113 |
| 19 | 6.3 | 6.50037165329436 | -0.200371653294361 |
| 20 | 7.1 | 7.00733646046228 | 0.0926635395377213 |
| 21 | 6.8 | 6.71735070836702 | 0.0826492916329766 |
| 22 | 7.3 | 7.27674029295754 | 0.0232597070424619 |
| 23 | 6.4 | 6.62716862979572 | -0.227168629795722 |
| 24 | 6.8 | 6.87505529519688 | -0.0750552951968792 |
| 25 | 7.2 | 6.83808566347504 | 0.361914336524963 |
| 26 | 6.4 | 6.34164021067202 | 0.0583597893279758 |
| 27 | 6.6 | 6.8028011287696 | -0.202801128769602 |
| 28 | 6.8 | 6.56015789460165 | 0.239842105398347 |
| 29 | 6.1 | 6.23984804432862 | -0.139848044328621 |
| 30 | 6.5 | 6.82232627045329 | -0.322326270453292 |
| 31 | 6.4 | 6.3354844961717 | 0.0645155038282995 |
| 32 | 6 | 6.15011945108905 | -0.150119451089046 |
| 33 | 6 | 6.38236303276735 | -0.382363032767349 |
| 34 | 7.3 | 7.27674029295754 | 0.0232597070424619 |
| 35 | 6.1 | 6.11104785141792 | -0.0110478514179177 |
| 36 | 6.7 | 7.0335500727241 | -0.333550072724105 |
| 37 | 6.4 | 6.5974806689817 | -0.197480668981698 |
| 38 | 5.8 | 5.97276246233688 | -0.172762462336878 |
| 39 | 6.9 | 6.85610273090796 | 0.043897269092039 |
| 40 | 7 | 7.02165825889132 | -0.0216582588913217 |
| 41 | 7.3 | 6.81078248475974 | 0.489217515240259 |
| 42 | 5.9 | 5.77694776918253 | 0.123052230817475 |
| 43 | 6.2 | 6.44015844681562 | -0.240158446815625 |
| 44 | 6.8 | 7.01991994842145 | -0.219919948421446 |
| 45 | 7 | 6.85158236882005 | 0.148417631179946 |
| 46 | 5.9 | 5.30652438522779 | 0.593475614772211 |
| 47 | 6.1 | 6.32751520664154 | -0.227515206641542 |
| 48 | 5.7 | 6.198832904207 | -0.498832904207001 |
| 49 | 7.1 | 7.02283013699327 | 0.0771698630067342 |
| 50 | 5.8 | 6.2094750450265 | -0.409475045026501 |
| 51 | 7.4 | 7.06097619479748 | 0.339023805202517 |
| 52 | 6.8 | 6.8014858275243 | -0.00148582752430329 |
| 53 | 6.8 | 6.70448126571023 | 0.0955187342897736 |
| 54 | 7 | 6.82959834427763 | 0.170401655722373 |
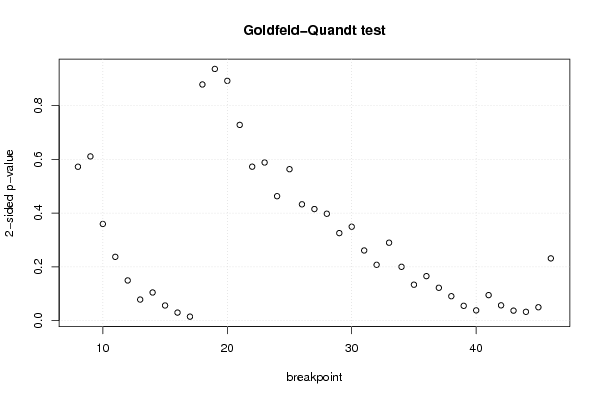
| Goldfeld-Quandt test for Heteroskedasticity | |||
| p-values | Alternative Hypothesis | ||
| breakpoint index | greater | 2-sided | less |
| 8 | 0.286048075185397 | 0.572096150370794 | 0.713951924814603 |
| 9 | 0.30523552330061 | 0.610471046601219 | 0.69476447669939 |
| 10 | 0.179743224618973 | 0.359486449237946 | 0.820256775381027 |
| 11 | 0.118628635068766 | 0.237257270137531 | 0.881371364931234 |
| 12 | 0.0747521210093732 | 0.149504242018746 | 0.925247878990627 |
| 13 | 0.039224860372961 | 0.078449720745922 | 0.96077513962704 |
| 14 | 0.0523661495163532 | 0.104732299032706 | 0.947633850483647 |
| 15 | 0.0282107790787211 | 0.0564215581574423 | 0.97178922092128 |
| 16 | 0.015033437161634 | 0.0300668743232681 | 0.984966562838366 |
| 17 | 0.00746595142365502 | 0.01493190284731 | 0.992534048576345 |
| 18 | 0.561038588854905 | 0.87792282229019 | 0.438961411145095 |
| 19 | 0.532156136206185 | 0.93568772758763 | 0.467843863793815 |
| 20 | 0.445716043044195 | 0.89143208608839 | 0.554283956955805 |
| 21 | 0.363880277021774 | 0.727760554043548 | 0.636119722978226 |
| 22 | 0.286166773227947 | 0.572333546455894 | 0.713833226772053 |
| 23 | 0.293974204366866 | 0.587948408733732 | 0.706025795633134 |
| 24 | 0.231360895427348 | 0.462721790854696 | 0.768639104572652 |
| 25 | 0.281519087799959 | 0.563038175599918 | 0.718480912200041 |
| 26 | 0.216307554053464 | 0.432615108106927 | 0.783692445946536 |
| 27 | 0.207439420269825 | 0.414878840539651 | 0.792560579730175 |
| 28 | 0.198719324488744 | 0.397438648977488 | 0.801280675511256 |
| 29 | 0.162738845195896 | 0.325477690391792 | 0.837261154804104 |
| 30 | 0.174595456754882 | 0.349190913509765 | 0.825404543245118 |
| 31 | 0.130458061425241 | 0.260916122850483 | 0.869541938574759 |
| 32 | 0.103833898131014 | 0.207667796262028 | 0.896166101868986 |
| 33 | 0.144853427724198 | 0.289706855448396 | 0.855146572275802 |
| 34 | 0.100128546828263 | 0.200257093656527 | 0.899871453171737 |
| 35 | 0.066808042663104 | 0.133616085326208 | 0.933191957336896 |
| 36 | 0.0827640560119361 | 0.165528112023872 | 0.917235943988064 |
| 37 | 0.0611325055383198 | 0.12226501107664 | 0.93886749446168 |
| 38 | 0.0454385216481936 | 0.0908770432963873 | 0.954561478351806 |
| 39 | 0.0275924230604014 | 0.0551848461208029 | 0.972407576939599 |
| 40 | 0.0190956555340728 | 0.0381913110681456 | 0.980904344465927 |
| 41 | 0.0474693062148107 | 0.0949386124296213 | 0.95253069378519 |
| 42 | 0.028492804944222 | 0.0569856098884441 | 0.971507195055778 |
| 43 | 0.018616726621752 | 0.037233453243504 | 0.981383273378248 |
| 44 | 0.016422954609859 | 0.0328459092197181 | 0.98357704539014 |
| 45 | 0.0249398650260114 | 0.0498797300520227 | 0.975060134973989 |
| 46 | 0.884221274359827 | 0.231557451280346 | 0.115778725640173 |
| Meta Analysis of Goldfeld-Quandt test for Heteroskedasticity | |||
| Description | # significant tests | % significant tests | OK/NOK |
| 1% type I error level | 0 | 0 | OK |
| 5% type I error level | 6 | 0.153846153846154 | NOK |
| 10% type I error level | 12 | 0.307692307692308 | NOK |