Free Statistics

of Irreproducible Research!

Author's title

Author*Unverified author*
R Software Modulerwasp_autocorrelation.wasp
Title produced by software(Partial) Autocorrelation Function
Date of computationThu, 24 Nov 2011 14:35:18 -0500
Cite this page as followsStatistical Computations at FreeStatistics.org, Office for Research Development and Education, URL https://freestatistics.org/blog/index.php?v=date/2011/Nov/24/t1322163352upu2msdmoba16hg.htm/, Retrieved Thu, 18 Apr 2024 09:10:48 +0000
Statistical Computations at FreeStatistics.org, Office for Research Development and Education, URL https://freestatistics.org/blog/index.php?pk=147169, Retrieved Thu, 18 Apr 2024 09:10:48 +0000
QR Codes:

Original text written by user:
IsPrivate?No (this computation is public)
User-defined keywordsKDGP2W12
Estimated Impact87
Family? (F = Feedback message, R = changed R code, M = changed R Module, P = changed Parameters, D = changed Data)
-       [(Partial) Autocorrelation Function] [Autocorrelatie be...] [2011-11-24 19:35:18] [e09593412f775de82555261d5bbd0b3f] [Current]
Feedback Forum

Post a new message
Dataseries X:
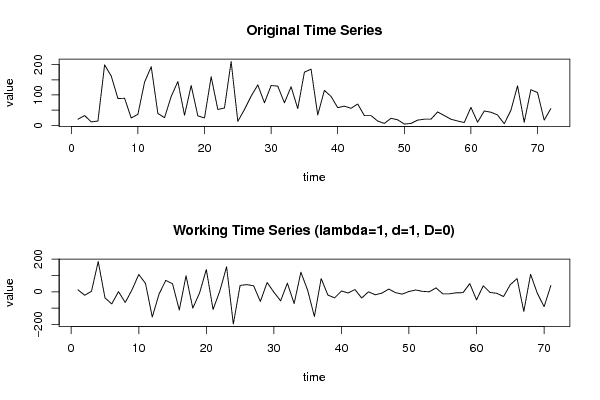
20
32
11
14
199
162
88
89
24
36
142
193
39
25
95
144
33
131
31
24
160
52
57
210
13
52
96
133
74
131
129
74
127
55
175
185
34
115
95
58
63
56
70
32
32
14
6
23
18
4
6
17
20
20
44
32
20
14
9
59
10
47
43
34
5
49
130
10
117
108
17
55


Summary of computational transaction
Raw Inputview raw input (R code)
Raw Outputview raw output of R engine
Computing time2 seconds
R Server'Herman Ole Andreas Wold' @ wold.wessa.net

\begin{tabular}{lllllllll}
\hline
Summary of computational transaction \tabularnewline
Raw Input & view raw input (R code)  \tabularnewline
Raw Output & view raw output of R engine  \tabularnewline
Computing time & 2 seconds \tabularnewline
R Server & 'Herman Ole Andreas Wold' @ wold.wessa.net \tabularnewline
\hline
\end{tabular}
%Source: https://freestatistics.org/blog/index.php?pk=147169&T=0

[TABLE]
[ROW][C]Summary of computational transaction[/C][/ROW]
[ROW][C]Raw Input[/C][C]view raw input (R code) [/C][/ROW]
[ROW][C]Raw Output[/C][C]view raw output of R engine [/C][/ROW]
[ROW][C]Computing time[/C][C]2 seconds[/C][/ROW]
[ROW][C]R Server[/C][C]'Herman Ole Andreas Wold' @ wold.wessa.net[/C][/ROW]
[/TABLE]
Source: https://freestatistics.org/blog/index.php?pk=147169&T=0

Globally Unique Identifier (entire table): ba.freestatistics.org/blog/index.php?pk=147169&T=0

As an alternative you can also use a QR Code:  

The GUIDs for individual cells are displayed in the table below:

Summary of computational transaction
Raw Inputview raw input (R code)
Raw Outputview raw output of R engine
Computing time2 seconds
R Server'Herman Ole Andreas Wold' @ wold.wessa.net


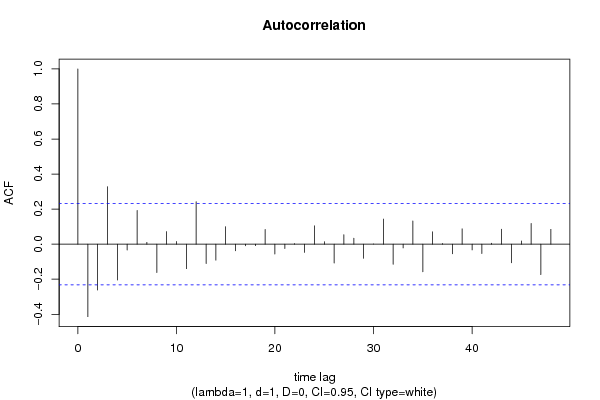
Autocorrelation Function
Time lag kACF(k)T-STATP-value
1-0.413698-3.48590.000423
2-0.261682-2.2050.015348
30.3273132.7580.003695
4-0.204152-1.72020.044875
5-0.033422-0.28160.389528
60.1921551.61910.054927
70.0103980.08760.465214
8-0.161389-1.35990.089084
90.0717730.60480.27363
100.0155050.13070.448211
11-0.139739-1.17750.121471
120.2421032.040.022536
13-0.110124-0.92790.178296
14-0.091311-0.76940.222105
150.0993360.8370.202695
16-0.037493-0.31590.376493
17-0.008693-0.07330.470907
18-0.008311-0.070.472182
190.0841890.70940.240204
20-0.056124-0.47290.318864
21-0.025222-0.21250.416152
220.0029280.02470.490192
23-0.046964-0.39570.346747
240.1042930.87880.191241
250.013510.11380.454844
26-0.107356-0.90460.184368
270.0542610.45720.324458
280.0333670.28120.389704
29-0.080771-0.68060.249172
300.0002290.00190.499232
310.1431831.20650.115818
32-0.115006-0.96910.167902
33-0.021388-0.18020.428748
340.1318941.11140.135082
35-0.157212-1.32470.094761
360.0701860.59140.278066
370.0040990.03450.486271
38-0.055283-0.46580.321384
390.0875140.73740.231653
40-0.032526-0.27410.392413
41-0.052996-0.44660.328278
420.0051340.04330.482809
430.0853060.71880.237311
44-0.106245-0.89520.186843
450.0177440.14950.440786
460.1176380.99120.162468
47-0.173712-1.46370.073841
480.0846590.71340.238983

\begin{tabular}{lllllllll}
\hline
Autocorrelation Function \tabularnewline
Time lag k & ACF(k) & T-STAT & P-value \tabularnewline
1 & -0.413698 & -3.4859 & 0.000423 \tabularnewline
2 & -0.261682 & -2.205 & 0.015348 \tabularnewline
3 & 0.327313 & 2.758 & 0.003695 \tabularnewline
4 & -0.204152 & -1.7202 & 0.044875 \tabularnewline
5 & -0.033422 & -0.2816 & 0.389528 \tabularnewline
6 & 0.192155 & 1.6191 & 0.054927 \tabularnewline
7 & 0.010398 & 0.0876 & 0.465214 \tabularnewline
8 & -0.161389 & -1.3599 & 0.089084 \tabularnewline
9 & 0.071773 & 0.6048 & 0.27363 \tabularnewline
10 & 0.015505 & 0.1307 & 0.448211 \tabularnewline
11 & -0.139739 & -1.1775 & 0.121471 \tabularnewline
12 & 0.242103 & 2.04 & 0.022536 \tabularnewline
13 & -0.110124 & -0.9279 & 0.178296 \tabularnewline
14 & -0.091311 & -0.7694 & 0.222105 \tabularnewline
15 & 0.099336 & 0.837 & 0.202695 \tabularnewline
16 & -0.037493 & -0.3159 & 0.376493 \tabularnewline
17 & -0.008693 & -0.0733 & 0.470907 \tabularnewline
18 & -0.008311 & -0.07 & 0.472182 \tabularnewline
19 & 0.084189 & 0.7094 & 0.240204 \tabularnewline
20 & -0.056124 & -0.4729 & 0.318864 \tabularnewline
21 & -0.025222 & -0.2125 & 0.416152 \tabularnewline
22 & 0.002928 & 0.0247 & 0.490192 \tabularnewline
23 & -0.046964 & -0.3957 & 0.346747 \tabularnewline
24 & 0.104293 & 0.8788 & 0.191241 \tabularnewline
25 & 0.01351 & 0.1138 & 0.454844 \tabularnewline
26 & -0.107356 & -0.9046 & 0.184368 \tabularnewline
27 & 0.054261 & 0.4572 & 0.324458 \tabularnewline
28 & 0.033367 & 0.2812 & 0.389704 \tabularnewline
29 & -0.080771 & -0.6806 & 0.249172 \tabularnewline
30 & 0.000229 & 0.0019 & 0.499232 \tabularnewline
31 & 0.143183 & 1.2065 & 0.115818 \tabularnewline
32 & -0.115006 & -0.9691 & 0.167902 \tabularnewline
33 & -0.021388 & -0.1802 & 0.428748 \tabularnewline
34 & 0.131894 & 1.1114 & 0.135082 \tabularnewline
35 & -0.157212 & -1.3247 & 0.094761 \tabularnewline
36 & 0.070186 & 0.5914 & 0.278066 \tabularnewline
37 & 0.004099 & 0.0345 & 0.486271 \tabularnewline
38 & -0.055283 & -0.4658 & 0.321384 \tabularnewline
39 & 0.087514 & 0.7374 & 0.231653 \tabularnewline
40 & -0.032526 & -0.2741 & 0.392413 \tabularnewline
41 & -0.052996 & -0.4466 & 0.328278 \tabularnewline
42 & 0.005134 & 0.0433 & 0.482809 \tabularnewline
43 & 0.085306 & 0.7188 & 0.237311 \tabularnewline
44 & -0.106245 & -0.8952 & 0.186843 \tabularnewline
45 & 0.017744 & 0.1495 & 0.440786 \tabularnewline
46 & 0.117638 & 0.9912 & 0.162468 \tabularnewline
47 & -0.173712 & -1.4637 & 0.073841 \tabularnewline
48 & 0.084659 & 0.7134 & 0.238983 \tabularnewline
\hline
\end{tabular}
%Source: https://freestatistics.org/blog/index.php?pk=147169&T=1

[TABLE]
[ROW][C]Autocorrelation Function[/C][/ROW]
[ROW][C]Time lag k[/C][C]ACF(k)[/C][C]T-STAT[/C][C]P-value[/C][/ROW]
[ROW][C]1[/C][C]-0.413698[/C][C]-3.4859[/C][C]0.000423[/C][/ROW]
[ROW][C]2[/C][C]-0.261682[/C][C]-2.205[/C][C]0.015348[/C][/ROW]
[ROW][C]3[/C][C]0.327313[/C][C]2.758[/C][C]0.003695[/C][/ROW]
[ROW][C]4[/C][C]-0.204152[/C][C]-1.7202[/C][C]0.044875[/C][/ROW]
[ROW][C]5[/C][C]-0.033422[/C][C]-0.2816[/C][C]0.389528[/C][/ROW]
[ROW][C]6[/C][C]0.192155[/C][C]1.6191[/C][C]0.054927[/C][/ROW]
[ROW][C]7[/C][C]0.010398[/C][C]0.0876[/C][C]0.465214[/C][/ROW]
[ROW][C]8[/C][C]-0.161389[/C][C]-1.3599[/C][C]0.089084[/C][/ROW]
[ROW][C]9[/C][C]0.071773[/C][C]0.6048[/C][C]0.27363[/C][/ROW]
[ROW][C]10[/C][C]0.015505[/C][C]0.1307[/C][C]0.448211[/C][/ROW]
[ROW][C]11[/C][C]-0.139739[/C][C]-1.1775[/C][C]0.121471[/C][/ROW]
[ROW][C]12[/C][C]0.242103[/C][C]2.04[/C][C]0.022536[/C][/ROW]
[ROW][C]13[/C][C]-0.110124[/C][C]-0.9279[/C][C]0.178296[/C][/ROW]
[ROW][C]14[/C][C]-0.091311[/C][C]-0.7694[/C][C]0.222105[/C][/ROW]
[ROW][C]15[/C][C]0.099336[/C][C]0.837[/C][C]0.202695[/C][/ROW]
[ROW][C]16[/C][C]-0.037493[/C][C]-0.3159[/C][C]0.376493[/C][/ROW]
[ROW][C]17[/C][C]-0.008693[/C][C]-0.0733[/C][C]0.470907[/C][/ROW]
[ROW][C]18[/C][C]-0.008311[/C][C]-0.07[/C][C]0.472182[/C][/ROW]
[ROW][C]19[/C][C]0.084189[/C][C]0.7094[/C][C]0.240204[/C][/ROW]
[ROW][C]20[/C][C]-0.056124[/C][C]-0.4729[/C][C]0.318864[/C][/ROW]
[ROW][C]21[/C][C]-0.025222[/C][C]-0.2125[/C][C]0.416152[/C][/ROW]
[ROW][C]22[/C][C]0.002928[/C][C]0.0247[/C][C]0.490192[/C][/ROW]
[ROW][C]23[/C][C]-0.046964[/C][C]-0.3957[/C][C]0.346747[/C][/ROW]
[ROW][C]24[/C][C]0.104293[/C][C]0.8788[/C][C]0.191241[/C][/ROW]
[ROW][C]25[/C][C]0.01351[/C][C]0.1138[/C][C]0.454844[/C][/ROW]
[ROW][C]26[/C][C]-0.107356[/C][C]-0.9046[/C][C]0.184368[/C][/ROW]
[ROW][C]27[/C][C]0.054261[/C][C]0.4572[/C][C]0.324458[/C][/ROW]
[ROW][C]28[/C][C]0.033367[/C][C]0.2812[/C][C]0.389704[/C][/ROW]
[ROW][C]29[/C][C]-0.080771[/C][C]-0.6806[/C][C]0.249172[/C][/ROW]
[ROW][C]30[/C][C]0.000229[/C][C]0.0019[/C][C]0.499232[/C][/ROW]
[ROW][C]31[/C][C]0.143183[/C][C]1.2065[/C][C]0.115818[/C][/ROW]
[ROW][C]32[/C][C]-0.115006[/C][C]-0.9691[/C][C]0.167902[/C][/ROW]
[ROW][C]33[/C][C]-0.021388[/C][C]-0.1802[/C][C]0.428748[/C][/ROW]
[ROW][C]34[/C][C]0.131894[/C][C]1.1114[/C][C]0.135082[/C][/ROW]
[ROW][C]35[/C][C]-0.157212[/C][C]-1.3247[/C][C]0.094761[/C][/ROW]
[ROW][C]36[/C][C]0.070186[/C][C]0.5914[/C][C]0.278066[/C][/ROW]
[ROW][C]37[/C][C]0.004099[/C][C]0.0345[/C][C]0.486271[/C][/ROW]
[ROW][C]38[/C][C]-0.055283[/C][C]-0.4658[/C][C]0.321384[/C][/ROW]
[ROW][C]39[/C][C]0.087514[/C][C]0.7374[/C][C]0.231653[/C][/ROW]
[ROW][C]40[/C][C]-0.032526[/C][C]-0.2741[/C][C]0.392413[/C][/ROW]
[ROW][C]41[/C][C]-0.052996[/C][C]-0.4466[/C][C]0.328278[/C][/ROW]
[ROW][C]42[/C][C]0.005134[/C][C]0.0433[/C][C]0.482809[/C][/ROW]
[ROW][C]43[/C][C]0.085306[/C][C]0.7188[/C][C]0.237311[/C][/ROW]
[ROW][C]44[/C][C]-0.106245[/C][C]-0.8952[/C][C]0.186843[/C][/ROW]
[ROW][C]45[/C][C]0.017744[/C][C]0.1495[/C][C]0.440786[/C][/ROW]
[ROW][C]46[/C][C]0.117638[/C][C]0.9912[/C][C]0.162468[/C][/ROW]
[ROW][C]47[/C][C]-0.173712[/C][C]-1.4637[/C][C]0.073841[/C][/ROW]
[ROW][C]48[/C][C]0.084659[/C][C]0.7134[/C][C]0.238983[/C][/ROW]
[/TABLE]
Source: https://freestatistics.org/blog/index.php?pk=147169&T=1

Globally Unique Identifier (entire table): ba.freestatistics.org/blog/index.php?pk=147169&T=1

As an alternative you can also use a QR Code:  

The GUIDs for individual cells are displayed in the table below:

Autocorrelation Function
Time lag kACF(k)T-STATP-value
1-0.413698-3.48590.000423
2-0.261682-2.2050.015348
30.3273132.7580.003695
4-0.204152-1.72020.044875
5-0.033422-0.28160.389528
60.1921551.61910.054927
70.0103980.08760.465214
8-0.161389-1.35990.089084
90.0717730.60480.27363
100.0155050.13070.448211
11-0.139739-1.17750.121471
120.2421032.040.022536
13-0.110124-0.92790.178296
14-0.091311-0.76940.222105
150.0993360.8370.202695
16-0.037493-0.31590.376493
17-0.008693-0.07330.470907
18-0.008311-0.070.472182
190.0841890.70940.240204
20-0.056124-0.47290.318864
21-0.025222-0.21250.416152
220.0029280.02470.490192
23-0.046964-0.39570.346747
240.1042930.87880.191241
250.013510.11380.454844
26-0.107356-0.90460.184368
270.0542610.45720.324458
280.0333670.28120.389704
29-0.080771-0.68060.249172
300.0002290.00190.499232
310.1431831.20650.115818
32-0.115006-0.96910.167902
33-0.021388-0.18020.428748
340.1318941.11140.135082
35-0.157212-1.32470.094761
360.0701860.59140.278066
370.0040990.03450.486271
38-0.055283-0.46580.321384
390.0875140.73740.231653
40-0.032526-0.27410.392413
41-0.052996-0.44660.328278
420.0051340.04330.482809
430.0853060.71880.237311
44-0.106245-0.89520.186843
450.0177440.14950.440786
460.1176380.99120.162468
47-0.173712-1.46370.073841
480.0846590.71340.238983


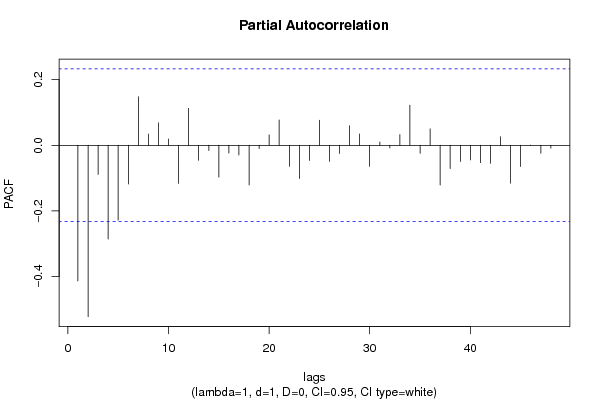
Partial Autocorrelation Function
Time lag kPACF(k)T-STATP-value
1-0.413698-3.48590.000423
2-0.5222-4.40011.9e-05
3-0.088764-0.74790.228483
4-0.28568-2.40720.009339
5-0.228126-1.92220.029295
6-0.118244-0.99630.161234
70.147791.24530.108557
80.0340390.28680.387543
90.0682530.57510.283518
100.0191040.1610.436285
11-0.116207-0.97920.165409
120.1125330.94820.173117
13-0.04568-0.38490.350729
14-0.015776-0.13290.447313
15-0.097104-0.81820.207987
16-0.023419-0.19730.422065
17-0.029621-0.24960.401813
18-0.121059-1.02010.155581
19-0.009599-0.08090.467881
200.0317420.26750.394943
210.07710.64970.259005
22-0.064139-0.54040.29529
23-0.101505-0.85530.197632
24-0.046374-0.39080.348573
250.0762490.64250.261312
26-0.049097-0.41370.340172
27-0.02511-0.21160.41652
280.0594910.50130.308861
290.0342510.28860.386863
30-0.063948-0.53880.295842
310.0100890.0850.466246
32-0.008442-0.07110.471744
330.0325490.27430.39234
340.1222681.03020.153195
35-0.024076-0.20290.419909
360.0500210.42150.337337
37-0.121146-1.02080.155409
38-0.070614-0.5950.276865
39-0.049401-0.41630.339237
40-0.044432-0.37440.354615
41-0.052848-0.44530.328726
42-0.054902-0.46260.322527
430.0261030.220.41327
44-0.115376-0.97220.167131
45-0.064775-0.54580.293457
46-0.000446-0.00380.498506
47-0.024104-0.20310.419819
48-0.0087-0.07330.470885

\begin{tabular}{lllllllll}
\hline
Partial Autocorrelation Function \tabularnewline
Time lag k & PACF(k) & T-STAT & P-value \tabularnewline
1 & -0.413698 & -3.4859 & 0.000423 \tabularnewline
2 & -0.5222 & -4.4001 & 1.9e-05 \tabularnewline
3 & -0.088764 & -0.7479 & 0.228483 \tabularnewline
4 & -0.28568 & -2.4072 & 0.009339 \tabularnewline
5 & -0.228126 & -1.9222 & 0.029295 \tabularnewline
6 & -0.118244 & -0.9963 & 0.161234 \tabularnewline
7 & 0.14779 & 1.2453 & 0.108557 \tabularnewline
8 & 0.034039 & 0.2868 & 0.387543 \tabularnewline
9 & 0.068253 & 0.5751 & 0.283518 \tabularnewline
10 & 0.019104 & 0.161 & 0.436285 \tabularnewline
11 & -0.116207 & -0.9792 & 0.165409 \tabularnewline
12 & 0.112533 & 0.9482 & 0.173117 \tabularnewline
13 & -0.04568 & -0.3849 & 0.350729 \tabularnewline
14 & -0.015776 & -0.1329 & 0.447313 \tabularnewline
15 & -0.097104 & -0.8182 & 0.207987 \tabularnewline
16 & -0.023419 & -0.1973 & 0.422065 \tabularnewline
17 & -0.029621 & -0.2496 & 0.401813 \tabularnewline
18 & -0.121059 & -1.0201 & 0.155581 \tabularnewline
19 & -0.009599 & -0.0809 & 0.467881 \tabularnewline
20 & 0.031742 & 0.2675 & 0.394943 \tabularnewline
21 & 0.0771 & 0.6497 & 0.259005 \tabularnewline
22 & -0.064139 & -0.5404 & 0.29529 \tabularnewline
23 & -0.101505 & -0.8553 & 0.197632 \tabularnewline
24 & -0.046374 & -0.3908 & 0.348573 \tabularnewline
25 & 0.076249 & 0.6425 & 0.261312 \tabularnewline
26 & -0.049097 & -0.4137 & 0.340172 \tabularnewline
27 & -0.02511 & -0.2116 & 0.41652 \tabularnewline
28 & 0.059491 & 0.5013 & 0.308861 \tabularnewline
29 & 0.034251 & 0.2886 & 0.386863 \tabularnewline
30 & -0.063948 & -0.5388 & 0.295842 \tabularnewline
31 & 0.010089 & 0.085 & 0.466246 \tabularnewline
32 & -0.008442 & -0.0711 & 0.471744 \tabularnewline
33 & 0.032549 & 0.2743 & 0.39234 \tabularnewline
34 & 0.122268 & 1.0302 & 0.153195 \tabularnewline
35 & -0.024076 & -0.2029 & 0.419909 \tabularnewline
36 & 0.050021 & 0.4215 & 0.337337 \tabularnewline
37 & -0.121146 & -1.0208 & 0.155409 \tabularnewline
38 & -0.070614 & -0.595 & 0.276865 \tabularnewline
39 & -0.049401 & -0.4163 & 0.339237 \tabularnewline
40 & -0.044432 & -0.3744 & 0.354615 \tabularnewline
41 & -0.052848 & -0.4453 & 0.328726 \tabularnewline
42 & -0.054902 & -0.4626 & 0.322527 \tabularnewline
43 & 0.026103 & 0.22 & 0.41327 \tabularnewline
44 & -0.115376 & -0.9722 & 0.167131 \tabularnewline
45 & -0.064775 & -0.5458 & 0.293457 \tabularnewline
46 & -0.000446 & -0.0038 & 0.498506 \tabularnewline
47 & -0.024104 & -0.2031 & 0.419819 \tabularnewline
48 & -0.0087 & -0.0733 & 0.470885 \tabularnewline
\hline
\end{tabular}
%Source: https://freestatistics.org/blog/index.php?pk=147169&T=2

[TABLE]
[ROW][C]Partial Autocorrelation Function[/C][/ROW]
[ROW][C]Time lag k[/C][C]PACF(k)[/C][C]T-STAT[/C][C]P-value[/C][/ROW]
[ROW][C]1[/C][C]-0.413698[/C][C]-3.4859[/C][C]0.000423[/C][/ROW]
[ROW][C]2[/C][C]-0.5222[/C][C]-4.4001[/C][C]1.9e-05[/C][/ROW]
[ROW][C]3[/C][C]-0.088764[/C][C]-0.7479[/C][C]0.228483[/C][/ROW]
[ROW][C]4[/C][C]-0.28568[/C][C]-2.4072[/C][C]0.009339[/C][/ROW]
[ROW][C]5[/C][C]-0.228126[/C][C]-1.9222[/C][C]0.029295[/C][/ROW]
[ROW][C]6[/C][C]-0.118244[/C][C]-0.9963[/C][C]0.161234[/C][/ROW]
[ROW][C]7[/C][C]0.14779[/C][C]1.2453[/C][C]0.108557[/C][/ROW]
[ROW][C]8[/C][C]0.034039[/C][C]0.2868[/C][C]0.387543[/C][/ROW]
[ROW][C]9[/C][C]0.068253[/C][C]0.5751[/C][C]0.283518[/C][/ROW]
[ROW][C]10[/C][C]0.019104[/C][C]0.161[/C][C]0.436285[/C][/ROW]
[ROW][C]11[/C][C]-0.116207[/C][C]-0.9792[/C][C]0.165409[/C][/ROW]
[ROW][C]12[/C][C]0.112533[/C][C]0.9482[/C][C]0.173117[/C][/ROW]
[ROW][C]13[/C][C]-0.04568[/C][C]-0.3849[/C][C]0.350729[/C][/ROW]
[ROW][C]14[/C][C]-0.015776[/C][C]-0.1329[/C][C]0.447313[/C][/ROW]
[ROW][C]15[/C][C]-0.097104[/C][C]-0.8182[/C][C]0.207987[/C][/ROW]
[ROW][C]16[/C][C]-0.023419[/C][C]-0.1973[/C][C]0.422065[/C][/ROW]
[ROW][C]17[/C][C]-0.029621[/C][C]-0.2496[/C][C]0.401813[/C][/ROW]
[ROW][C]18[/C][C]-0.121059[/C][C]-1.0201[/C][C]0.155581[/C][/ROW]
[ROW][C]19[/C][C]-0.009599[/C][C]-0.0809[/C][C]0.467881[/C][/ROW]
[ROW][C]20[/C][C]0.031742[/C][C]0.2675[/C][C]0.394943[/C][/ROW]
[ROW][C]21[/C][C]0.0771[/C][C]0.6497[/C][C]0.259005[/C][/ROW]
[ROW][C]22[/C][C]-0.064139[/C][C]-0.5404[/C][C]0.29529[/C][/ROW]
[ROW][C]23[/C][C]-0.101505[/C][C]-0.8553[/C][C]0.197632[/C][/ROW]
[ROW][C]24[/C][C]-0.046374[/C][C]-0.3908[/C][C]0.348573[/C][/ROW]
[ROW][C]25[/C][C]0.076249[/C][C]0.6425[/C][C]0.261312[/C][/ROW]
[ROW][C]26[/C][C]-0.049097[/C][C]-0.4137[/C][C]0.340172[/C][/ROW]
[ROW][C]27[/C][C]-0.02511[/C][C]-0.2116[/C][C]0.41652[/C][/ROW]
[ROW][C]28[/C][C]0.059491[/C][C]0.5013[/C][C]0.308861[/C][/ROW]
[ROW][C]29[/C][C]0.034251[/C][C]0.2886[/C][C]0.386863[/C][/ROW]
[ROW][C]30[/C][C]-0.063948[/C][C]-0.5388[/C][C]0.295842[/C][/ROW]
[ROW][C]31[/C][C]0.010089[/C][C]0.085[/C][C]0.466246[/C][/ROW]
[ROW][C]32[/C][C]-0.008442[/C][C]-0.0711[/C][C]0.471744[/C][/ROW]
[ROW][C]33[/C][C]0.032549[/C][C]0.2743[/C][C]0.39234[/C][/ROW]
[ROW][C]34[/C][C]0.122268[/C][C]1.0302[/C][C]0.153195[/C][/ROW]
[ROW][C]35[/C][C]-0.024076[/C][C]-0.2029[/C][C]0.419909[/C][/ROW]
[ROW][C]36[/C][C]0.050021[/C][C]0.4215[/C][C]0.337337[/C][/ROW]
[ROW][C]37[/C][C]-0.121146[/C][C]-1.0208[/C][C]0.155409[/C][/ROW]
[ROW][C]38[/C][C]-0.070614[/C][C]-0.595[/C][C]0.276865[/C][/ROW]
[ROW][C]39[/C][C]-0.049401[/C][C]-0.4163[/C][C]0.339237[/C][/ROW]
[ROW][C]40[/C][C]-0.044432[/C][C]-0.3744[/C][C]0.354615[/C][/ROW]
[ROW][C]41[/C][C]-0.052848[/C][C]-0.4453[/C][C]0.328726[/C][/ROW]
[ROW][C]42[/C][C]-0.054902[/C][C]-0.4626[/C][C]0.322527[/C][/ROW]
[ROW][C]43[/C][C]0.026103[/C][C]0.22[/C][C]0.41327[/C][/ROW]
[ROW][C]44[/C][C]-0.115376[/C][C]-0.9722[/C][C]0.167131[/C][/ROW]
[ROW][C]45[/C][C]-0.064775[/C][C]-0.5458[/C][C]0.293457[/C][/ROW]
[ROW][C]46[/C][C]-0.000446[/C][C]-0.0038[/C][C]0.498506[/C][/ROW]
[ROW][C]47[/C][C]-0.024104[/C][C]-0.2031[/C][C]0.419819[/C][/ROW]
[ROW][C]48[/C][C]-0.0087[/C][C]-0.0733[/C][C]0.470885[/C][/ROW]
[/TABLE]
Source: https://freestatistics.org/blog/index.php?pk=147169&T=2

Globally Unique Identifier (entire table): ba.freestatistics.org/blog/index.php?pk=147169&T=2

As an alternative you can also use a QR Code:  

The GUIDs for individual cells are displayed in the table below:

Partial Autocorrelation Function
Time lag kPACF(k)T-STATP-value
1-0.413698-3.48590.000423
2-0.5222-4.40011.9e-05
3-0.088764-0.74790.228483
4-0.28568-2.40720.009339
5-0.228126-1.92220.029295
6-0.118244-0.99630.161234
70.147791.24530.108557
80.0340390.28680.387543
90.0682530.57510.283518
100.0191040.1610.436285
11-0.116207-0.97920.165409
120.1125330.94820.173117
13-0.04568-0.38490.350729
14-0.015776-0.13290.447313
15-0.097104-0.81820.207987
16-0.023419-0.19730.422065
17-0.029621-0.24960.401813
18-0.121059-1.02010.155581
19-0.009599-0.08090.467881
200.0317420.26750.394943
210.07710.64970.259005
22-0.064139-0.54040.29529
23-0.101505-0.85530.197632
24-0.046374-0.39080.348573
250.0762490.64250.261312
26-0.049097-0.41370.340172
27-0.02511-0.21160.41652
280.0594910.50130.308861
290.0342510.28860.386863
30-0.063948-0.53880.295842
310.0100890.0850.466246
32-0.008442-0.07110.471744
330.0325490.27430.39234
340.1222681.03020.153195
35-0.024076-0.20290.419909
360.0500210.42150.337337
37-0.121146-1.02080.155409
38-0.070614-0.5950.276865
39-0.049401-0.41630.339237
40-0.044432-0.37440.354615
41-0.052848-0.44530.328726
42-0.054902-0.46260.322527
430.0261030.220.41327
44-0.115376-0.97220.167131
45-0.064775-0.54580.293457
46-0.000446-0.00380.498506
47-0.024104-0.20310.419819
48-0.0087-0.07330.470885


Parameters (Session):
par1 = 48 ; par2 = 1 ; par3 = 1 ; par4 = 0 ; par5 = 12 ; par6 = White Noise ; par7 = 0.95 ;
Parameters (R input):
par1 = 48 ; par2 = 1 ; par3 = 1 ; par4 = 0 ; par5 = 12 ; par6 = White Noise ; par7 = 0.95 ; par8 = ;
R code (references can be found in the software module):
if (par1 == 'Default') {
par1 = 10*log10(length(x))
} else {
par1 <- as.numeric(par1)
}
par2 <- as.numeric(par2)
par3 <- as.numeric(par3)
par4 <- as.numeric(par4)
par5 <- as.numeric(par5)
if (par6 == 'White Noise') par6 <- 'white' else par6 <- 'ma'
par7 <- as.numeric(par7)
if (par8 != '') par8 <- as.numeric(par8)
ox <- x
if (par8 == '') {
if (par2 == 0) {
x <- log(x)
} else {
x <- (x ^ par2 - 1) / par2
}
} else {
x <- log(x,base=par8)
}
if (par3 > 0) x <- diff(x,lag=1,difference=par3)
if (par4 > 0) x <- diff(x,lag=par5,difference=par4)
bitmap(file='picts.png')
op <- par(mfrow=c(2,1))
plot(ox,type='l',main='Original Time Series',xlab='time',ylab='value')
if (par8=='') {
mytitle <- paste('Working Time Series (lambda=',par2,', d=',par3,', D=',par4,')',sep='')
mysub <- paste('(lambda=',par2,', d=',par3,', D=',par4,', CI=', par7, ', CI type=',par6,')',sep='')
} else {
mytitle <- paste('Working Time Series (base=',par8,', d=',par3,', D=',par4,')',sep='')
mysub <- paste('(base=',par8,', d=',par3,', D=',par4,', CI=', par7, ', CI type=',par6,')',sep='')
}
plot(x,type='l', main=mytitle,xlab='time',ylab='value')
par(op)
dev.off()
bitmap(file='pic1.png')
racf <- acf(x, par1, main='Autocorrelation', xlab='time lag', ylab='ACF', ci.type=par6, ci=par7, sub=mysub)
dev.off()
bitmap(file='pic2.png')
rpacf <- pacf(x,par1,main='Partial Autocorrelation',xlab='lags',ylab='PACF',sub=mysub)
dev.off()
(myacf <- c(racf$acf))
(mypacf <- c(rpacf$acf))
lengthx <- length(x)
sqrtn <- sqrt(lengthx)
load(file='createtable')
a<-table.start()
a<-table.row.start(a)
a<-table.element(a,'Autocorrelation Function',4,TRUE)
a<-table.row.end(a)
a<-table.row.start(a)
a<-table.element(a,'Time lag k',header=TRUE)
a<-table.element(a,hyperlink('basics.htm','ACF(k)','click here for more information about the Autocorrelation Function'),header=TRUE)
a<-table.element(a,'T-STAT',header=TRUE)
a<-table.element(a,'P-value',header=TRUE)
a<-table.row.end(a)
for (i in 2:(par1+1)) {
a<-table.row.start(a)
a<-table.element(a,i-1,header=TRUE)
a<-table.element(a,round(myacf[i],6))
mytstat <- myacf[i]*sqrtn
a<-table.element(a,round(mytstat,4))
a<-table.element(a,round(1-pt(abs(mytstat),lengthx),6))
a<-table.row.end(a)
}
a<-table.end(a)
table.save(a,file='mytable.tab')
a<-table.start()
a<-table.row.start(a)
a<-table.element(a,'Partial Autocorrelation Function',4,TRUE)
a<-table.row.end(a)
a<-table.row.start(a)
a<-table.element(a,'Time lag k',header=TRUE)
a<-table.element(a,hyperlink('basics.htm','PACF(k)','click here for more information about the Partial Autocorrelation Function'),header=TRUE)
a<-table.element(a,'T-STAT',header=TRUE)
a<-table.element(a,'P-value',header=TRUE)
a<-table.row.end(a)
for (i in 1:par1) {
a<-table.row.start(a)
a<-table.element(a,i,header=TRUE)
a<-table.element(a,round(mypacf[i],6))
mytstat <- mypacf[i]*sqrtn
a<-table.element(a,round(mytstat,4))
a<-table.element(a,round(1-pt(abs(mytstat),lengthx),6))
a<-table.row.end(a)
}
a<-table.end(a)
table.save(a,file='mytable1.tab')