| Multiple Linear Regression - Estimated Regression Equation |
| werkloosheid[t] = + 1.54451965078874 -0.112572244790881maand[t] -3.93284564582941indicator[t] + 1.00796554976765economie[t] + 0.995091256179223`financiën`[t] + 0.892220731906652spaarvermogen[t] + e[t] |
| Multiple Linear Regression - Ordinary Least Squares | |||||
| Variable | Parameter | S.D. | T-STAT H0: parameter = 0 | 2-tail p-value | 1-tail p-value |
| (Intercept) | 1.54451965078874 | 0.561517 | 2.7506 | 0.008078 | 0.004039 |
| maand | -0.112572244790881 | 0.044449 | -2.5326 | 0.014261 | 0.00713 |
| indicator | -3.93284564582941 | 0.029754 | -132.1801 | 0 | 0 |
| economie | 1.00796554976765 | 0.022118 | 45.5724 | 0 | 0 |
| `financiën` | 0.995091256179223 | 0.12856 | 7.7403 | 0 | 0 |
| spaarvermogen | 0.892220731906652 | 0.056435 | 15.8098 | 0 | 0 |
| Multiple Linear Regression - Regression Statistics | |
| Multiple R | 0.998822807707077 |
| R-squared | 0.997647001195849 |
| Adjusted R-squared | 0.997429130936206 |
| F-TEST (value) | 4579.08758555642 |
| F-TEST (DF numerator) | 5 |
| F-TEST (DF denominator) | 54 |
| p-value | 0 |
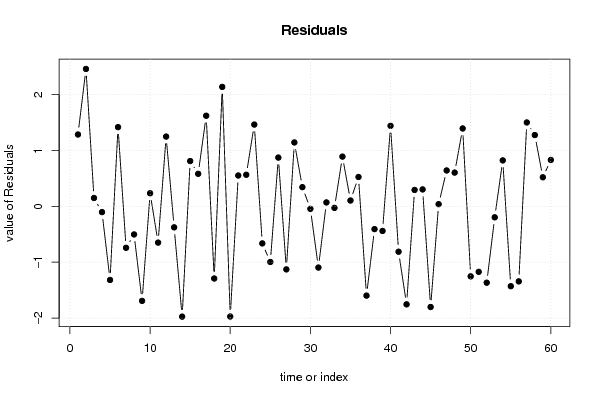
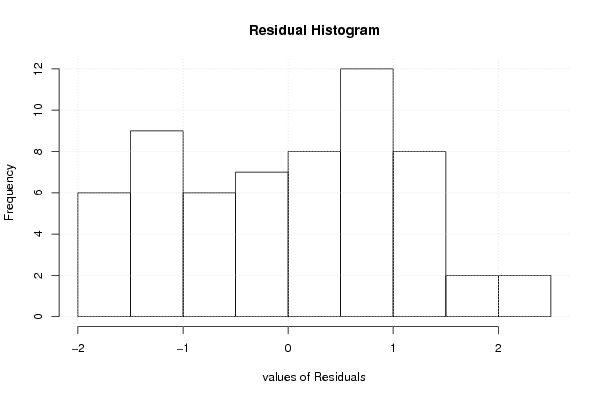
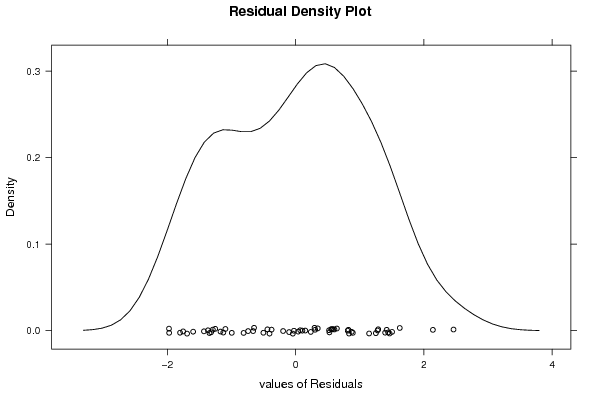
| Multiple Linear Regression - Residual Statistics | |
| Residual Standard Deviation | 1.1714645449262 |
| Sum Squared Residuals | 74.1057757210335 |
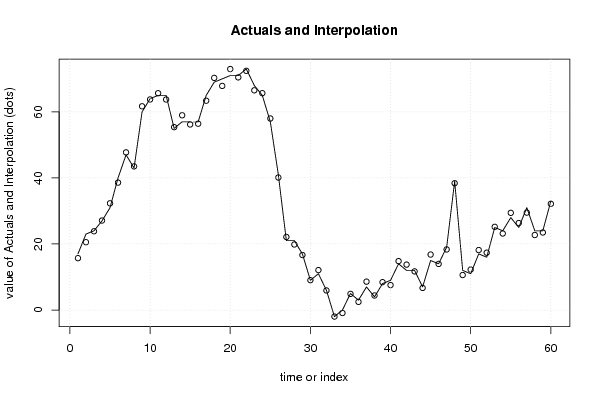
| Multiple Linear Regression - Actuals, Interpolation, and Residuals | |||
| Time or Index | Actuals | Interpolation Forecast | Residuals Prediction Error |
| 1 | 17 | 15.7134562600286 | 1.28654373997139 |
| 2 | 23 | 20.5392040357259 | 2.46079596427406 |
| 3 | 24 | 23.8506228640972 | 0.149377135902814 |
| 4 | 27 | 27.1028365760521 | -0.102836576052071 |
| 5 | 31 | 32.318295657129 | -1.31829565712903 |
| 6 | 40 | 38.5812504430567 | 1.41874955694335 |
| 7 | 47 | 47.7424294635515 | -0.742429463551456 |
| 8 | 43 | 43.5031234806668 | -0.503123480666782 |
| 9 | 60 | 61.6932343155321 | -1.69323431553206 |
| 10 | 64 | 63.7651979584137 | 0.234802041586304 |
| 11 | 65 | 65.6493373734295 | -0.649337373429457 |
| 12 | 65 | 63.7503115845451 | 1.24968841545488 |
| 13 | 55 | 55.3762728783173 | -0.376272878317265 |
| 14 | 57 | 58.9754397621134 | -1.97543976211336 |
| 15 | 57 | 56.1888804980193 | 0.811119501980662 |
| 16 | 57 | 56.4171975606712 | 0.582802439328785 |
| 17 | 65 | 63.3772866687368 | 1.62271333126324 |
| 18 | 69 | 70.2922335100337 | -1.29223351003371 |
| 19 | 70 | 67.8606166415854 | 2.13938335841456 |
| 20 | 71 | 72.9732051983898 | -1.97320519838984 |
| 21 | 71 | 70.4474568464843 | 0.552543153515694 |
| 22 | 73 | 72.4344667857726 | 0.565533214227353 |
| 23 | 68 | 66.535203197751 | 1.46479680224903 |
| 24 | 65 | 65.663536638226 | -0.663536638226012 |
| 25 | 57 | 57.9965598510108 | -0.996559851010837 |
| 26 | 41 | 40.1264748061954 | 0.873525193804586 |
| 27 | 21 | 22.12895920599 | -1.12895920599002 |
| 28 | 21 | 19.8555640071994 | 1.1444359928006 |
| 29 | 17 | 16.6562102655208 | 0.343789734479213 |
| 30 | 9 | 9.04458462369072 | -0.0445846236907148 |
| 31 | 11 | 12.0960998141912 | -1.09609981419123 |
| 32 | 6 | 5.92967040639594 | 0.070329593604059 |
| 33 | -2 | -1.9726499875726 | -0.0273500124274034 |
| 34 | 0 | -0.890735073779352 | 0.890735073779352 |
| 35 | 5 | 4.89545887279814 | 0.104541127201865 |
| 36 | 3 | 2.47424869605333 | 0.525751303946665 |
| 37 | 7 | 8.59865677365676 | -1.59865677365676 |
| 38 | 4 | 4.40790126841214 | -0.407901268412142 |
| 39 | 8 | 8.440444865444 | -0.440444865443997 |
| 40 | 9 | 7.55792585405566 | 1.44207414594434 |
| 41 | 14 | 14.8123992068729 | -0.812399206872865 |
| 42 | 12 | 13.7549302612071 | -1.75493026120707 |
| 43 | 12 | 11.7062240303934 | 0.293775969606582 |
| 44 | 7 | 6.69696151946638 | 0.303038480533619 |
| 45 | 15 | 16.8027657205393 | -1.80276572053927 |
| 46 | 14 | 13.9608553110602 | 0.0391446889398368 |
| 47 | 19 | 18.3573616262948 | 0.642638373705178 |
| 48 | 39 | 38.3954521072499 | 0.604547892750064 |
| 49 | 12 | 10.6054030722168 | 1.39459692778315 |
| 50 | 11 | 12.2541988804792 | -1.25419888047923 |
| 51 | 17 | 18.1728659095375 | -1.17286590953752 |
| 52 | 16 | 17.3674688352449 | -1.36746883524489 |
| 53 | 25 | 25.196531024594 | -0.196531024593982 |
| 54 | 24 | 23.1774273519886 | 0.822572648011439 |
| 55 | 28 | 29.4304545410414 | -1.43045454104141 |
| 56 | 25 | 26.3441802022519 | -1.34418020225188 |
| 57 | 31 | 29.4973773609655 | 1.50262263903449 |
| 58 | 24 | 22.722621305657 | 1.277378694343 |
| 59 | 24 | 23.4791963820127 | 0.520803617987262 |
| 60 | 33 | 32.1688549033352 | 0.831145096664806 |
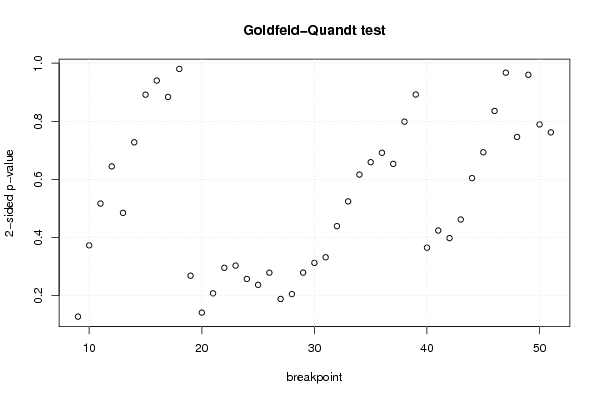
| Goldfeld-Quandt test for Heteroskedasticity | |||
| p-values | Alternative Hypothesis | ||
| breakpoint index | greater | 2-sided | less |
| 9 | 0.0637765021102843 | 0.127553004220569 | 0.936223497889716 |
| 10 | 0.186488053118419 | 0.372976106236839 | 0.81351194688158 |
| 11 | 0.258483886650325 | 0.516967773300651 | 0.741516113349675 |
| 12 | 0.322406860403231 | 0.644813720806461 | 0.677593139596769 |
| 13 | 0.242432022881071 | 0.484864045762142 | 0.757567977118929 |
| 14 | 0.636076503859449 | 0.727846992281102 | 0.363923496140551 |
| 15 | 0.554123260112801 | 0.891753479774399 | 0.445876739887199 |
| 16 | 0.470177785642281 | 0.940355571284563 | 0.529822214357718 |
| 17 | 0.558057144638603 | 0.883885710722793 | 0.441942855361397 |
| 18 | 0.490162873142111 | 0.980325746284222 | 0.509837126857889 |
| 19 | 0.865717907753179 | 0.268564184493642 | 0.134282092246821 |
| 20 | 0.929278653657792 | 0.141442692684415 | 0.0707213463422076 |
| 21 | 0.896030367016752 | 0.207939265966496 | 0.103969632983248 |
| 22 | 0.852087026834691 | 0.295825946330617 | 0.147912973165309 |
| 23 | 0.848319740165322 | 0.303360519669356 | 0.151680259834678 |
| 24 | 0.871355751222342 | 0.257288497555316 | 0.128644248777658 |
| 25 | 0.881461287891456 | 0.237077424217088 | 0.118538712108544 |
| 26 | 0.860487105405772 | 0.279025789188456 | 0.139512894594228 |
| 27 | 0.905778122693088 | 0.188443754613824 | 0.0942218773069118 |
| 28 | 0.897331522167966 | 0.205336955664068 | 0.102668477832034 |
| 29 | 0.860419900442159 | 0.279160199115682 | 0.139580099557841 |
| 30 | 0.843706954418073 | 0.312586091163855 | 0.156293045581927 |
| 31 | 0.833996608001868 | 0.332006783996264 | 0.166003391998132 |
| 32 | 0.780440256204384 | 0.439119487591232 | 0.219559743795616 |
| 33 | 0.737777449583711 | 0.524445100832577 | 0.262222550416289 |
| 34 | 0.691713133317156 | 0.616573733365688 | 0.308286866682844 |
| 35 | 0.67034580218062 | 0.65930839563876 | 0.32965419781938 |
| 36 | 0.654103059377896 | 0.691793881244208 | 0.345896940622104 |
| 37 | 0.673179920849217 | 0.653640158301565 | 0.326820079150783 |
| 38 | 0.600590131238942 | 0.798819737522115 | 0.399409868761058 |
| 39 | 0.553847068995054 | 0.892305862009891 | 0.446152931004946 |
| 40 | 0.817510437117659 | 0.364979125764683 | 0.182489562882341 |
| 41 | 0.787913377037937 | 0.424173245924126 | 0.212086622962063 |
| 42 | 0.801050114277729 | 0.397899771444542 | 0.198949885722271 |
| 43 | 0.769029014938003 | 0.461941970123995 | 0.230970985061997 |
| 44 | 0.697781100528199 | 0.604437798943603 | 0.302218899471802 |
| 45 | 0.653256848835484 | 0.693486302329032 | 0.346743151164516 |
| 46 | 0.582173247322012 | 0.835653505355976 | 0.417826752677988 |
| 47 | 0.483700336328196 | 0.967400672656392 | 0.516299663671804 |
| 48 | 0.373099429710948 | 0.746198859421896 | 0.626900570289052 |
| 49 | 0.480123960553187 | 0.960247921106374 | 0.519876039446813 |
| 50 | 0.394689869872243 | 0.789379739744487 | 0.605310130127757 |
| 51 | 0.381009874167566 | 0.762019748335131 | 0.618990125832434 |
| Meta Analysis of Goldfeld-Quandt test for Heteroskedasticity | |||
| Description | # significant tests | % significant tests | OK/NOK |
| 1% type I error level | 0 | 0 | OK |
| 5% type I error level | 0 | 0 | OK |
| 10% type I error level | 0 | 0 | OK |