| Multiple Linear Regression - Estimated Regression Equation |
| Inschrijvingen[t] = + 19502.4470588235 + 2507.87124183007M1[t] -1577.5908496732M2[t] -7522.11176470588M3[t] + 8180.36732026143M4[t] + 6553.44640522876M5[t] + 10835.9254901961M6[t] + 8339.8045751634M7[t] + 4933.08366013072M8[t] + 5528.76274509804M9[t] -786.958169934641M10[t] -1607.87908496732M11[t] + 32.7209150326797t + e[t] |
| Multiple Linear Regression - Ordinary Least Squares | |||||
| Variable | Parameter | S.D. | T-STAT H0: parameter = 0 | 2-tail p-value | 1-tail p-value |
| (Intercept) | 19502.4470588235 | 1184.025891 | 16.4713 | 0 | 0 |
| M1 | 2507.87124183007 | 1380.852737 | 1.8162 | 0.075591 | 0.037796 |
| M2 | -1577.5908496732 | 1449.351045 | -1.0885 | 0.281818 | 0.140909 |
| M3 | -7522.11176470588 | 1447.500208 | -5.1966 | 4e-06 | 2e-06 |
| M4 | 8180.36732026143 | 1445.842187 | 5.6579 | 1e-06 | 0 |
| M5 | 6553.44640522876 | 1444.377647 | 4.5372 | 3.8e-05 | 1.9e-05 |
| M6 | 10835.9254901961 | 1443.107177 | 7.5087 | 0 | 0 |
| M7 | 8339.8045751634 | 1442.03129 | 5.7834 | 1e-06 | 0 |
| M8 | 4933.08366013072 | 1441.150421 | 3.423 | 0.001276 | 0.000638 |
| M9 | 5528.76274509804 | 1440.464928 | 3.8382 | 0.000362 | 0.000181 |
| M10 | -786.958169934641 | 1439.975091 | -0.5465 | 0.587248 | 0.293624 |
| M11 | -1607.87908496732 | 1439.681108 | -1.1168 | 0.269626 | 0.134813 |
| t | 32.7209150326797 | 16.798496 | 1.9478 | 0.057294 | 0.028647 |
| Multiple Linear Regression - Regression Statistics | |
| Multiple R | 0.930278630238748 |
| R-squared | 0.865418329878881 |
| Adjusted R-squared | 0.831772912348601 |
| F-TEST (value) | 25.721729537166 |
| F-TEST (DF numerator) | 12 |
| F-TEST (DF denominator) | 48 |
| p-value | 1.11022302462516e-16 |
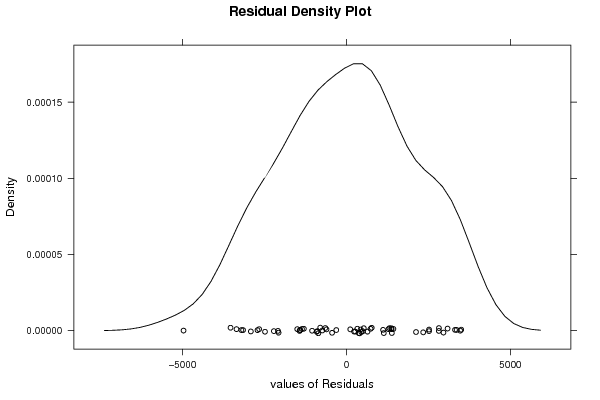
| Multiple Linear Regression - Residual Statistics | |
| Residual Standard Deviation | 2276.18073984856 |
| Sum Squared Residuals | 248687940.501961 |
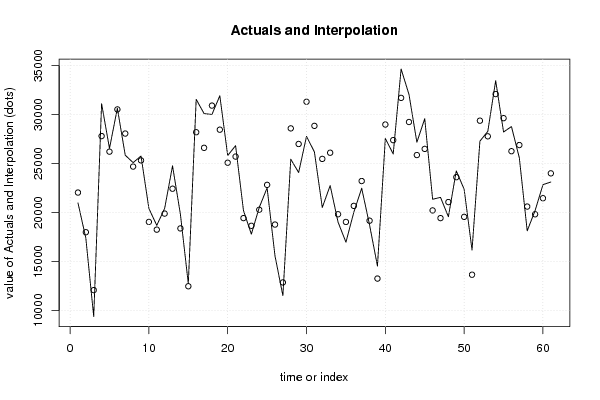
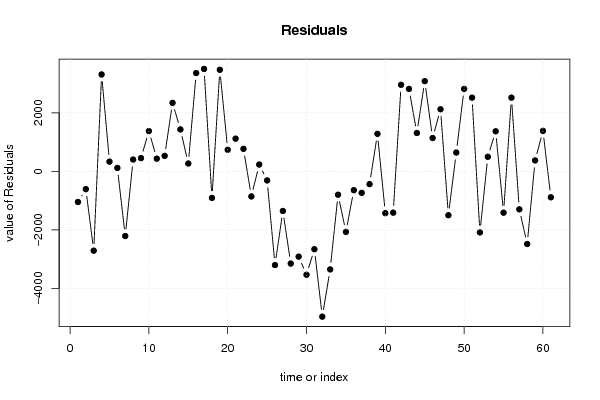
| Multiple Linear Regression - Actuals, Interpolation, and Residuals | |||
| Time or Index | Actuals | Interpolation Forecast | Residuals Prediction Error |
| 1 | 20995 | 22043.0392156863 | -1048.03921568627 |
| 2 | 17382 | 17990.2980392157 | -608.298039215688 |
| 3 | 9367 | 12078.4980392157 | -2711.49803921569 |
| 4 | 31124 | 27813.6980392157 | 3310.30196078431 |
| 5 | 26551 | 26219.4980392157 | 331.501960784314 |
| 6 | 30651 | 30534.6980392157 | 116.301960784313 |
| 7 | 25859 | 28071.2980392157 | -2212.29803921569 |
| 8 | 25100 | 24697.2980392157 | 402.701960784312 |
| 9 | 25778 | 25325.6980392157 | 452.301960784313 |
| 10 | 20418 | 19042.6980392157 | 1375.30196078431 |
| 11 | 18688 | 18254.4980392157 | 433.501960784313 |
| 12 | 20424 | 19895.0980392157 | 528.901960784312 |
| 13 | 24776 | 22435.6901960784 | 2340.30980392157 |
| 14 | 19814 | 18382.9490196078 | 1431.05098039216 |
| 15 | 12738 | 12471.1490196078 | 266.850980392157 |
| 16 | 31566 | 28206.3490196078 | 3359.65098039216 |
| 17 | 30111 | 26612.1490196078 | 3498.85098039216 |
| 18 | 30019 | 30927.3490196078 | -908.349019607844 |
| 19 | 31934 | 28463.9490196078 | 3470.05098039216 |
| 20 | 25826 | 25089.9490196078 | 736.050980392156 |
| 21 | 26835 | 25718.3490196078 | 1116.65098039216 |
| 22 | 20205 | 19435.3490196078 | 769.650980392157 |
| 23 | 17789 | 18647.1490196078 | -858.149019607844 |
| 24 | 20520 | 20287.7490196078 | 232.250980392156 |
| 25 | 22518 | 22828.3411764706 | -310.34117647059 |
| 26 | 15572 | 18775.6 | -3203.6 |
| 27 | 11509 | 12863.8 | -1354.8 |
| 28 | 25447 | 28599 | -3152 |
| 29 | 24090 | 27004.8 | -2914.8 |
| 30 | 27786 | 31320 | -3534 |
| 31 | 26195 | 28856.6 | -2661.6 |
| 32 | 20516 | 25482.6 | -4966.6 |
| 33 | 22759 | 26111 | -3352 |
| 34 | 19028 | 19828 | -800.000000000001 |
| 35 | 16971 | 19039.8 | -2068.8 |
| 36 | 20036 | 20680.4 | -644.400000000001 |
| 37 | 22485 | 23220.9921568627 | -735.992156862747 |
| 38 | 18730 | 19168.2509803922 | -438.250980392156 |
| 39 | 14538 | 13256.4509803922 | 1281.54901960784 |
| 40 | 27561 | 28991.6509803922 | -1430.65098039216 |
| 41 | 25985 | 27397.4509803922 | -1412.45098039216 |
| 42 | 34670 | 31712.6509803922 | 2957.34901960784 |
| 43 | 32066 | 29249.2509803922 | 2816.74901960784 |
| 44 | 27186 | 25875.2509803922 | 1310.74901960784 |
| 45 | 29586 | 26503.6509803922 | 3082.34901960784 |
| 46 | 21359 | 20220.6509803922 | 1138.34901960784 |
| 47 | 21553 | 19432.4509803922 | 2120.54901960784 |
| 48 | 19573 | 21073.0509803922 | -1500.05098039216 |
| 49 | 24256 | 23613.6431372549 | 642.356862745097 |
| 50 | 22380 | 19560.9019607843 | 2819.09803921569 |
| 51 | 16167 | 13649.1019607843 | 2517.89803921569 |
| 52 | 27297 | 29384.3019607843 | -2087.30196078431 |
| 53 | 28287 | 27790.1019607843 | 496.898039215686 |
| 54 | 33474 | 32105.3019607843 | 1368.69803921569 |
| 55 | 28229 | 29641.9019607843 | -1412.90196078431 |
| 56 | 28785 | 26267.9019607843 | 2517.09803921569 |
| 57 | 25597 | 26896.3019607843 | -1299.30196078431 |
| 58 | 18130 | 20613.3019607843 | -2483.30196078431 |
| 59 | 20198 | 19825.1019607843 | 372.898039215688 |
| 60 | 22849 | 21465.7019607843 | 1383.29803921569 |
| 61 | 23118 | 24006.2941176471 | -888.294117647059 |
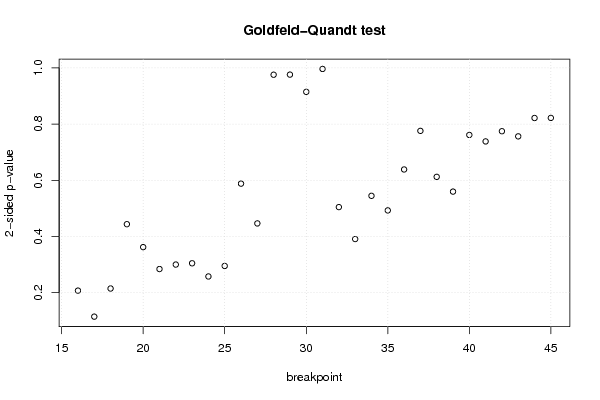
| Goldfeld-Quandt test for Heteroskedasticity | |||
| p-values | Alternative Hypothesis | ||
| breakpoint index | greater | 2-sided | less |
| 16 | 0.10369081994291 | 0.207381639885819 | 0.89630918005709 |
| 17 | 0.0573818052464886 | 0.114763610492977 | 0.942618194753511 |
| 18 | 0.107445086755682 | 0.214890173511364 | 0.892554913244318 |
| 19 | 0.221863953363296 | 0.443727906726592 | 0.778136046636704 |
| 20 | 0.18108621256826 | 0.36217242513652 | 0.81891378743174 |
| 21 | 0.142112997964868 | 0.284225995929735 | 0.857887002035132 |
| 22 | 0.15006759332243 | 0.300135186644859 | 0.849932406677571 |
| 23 | 0.152341915020563 | 0.304683830041126 | 0.847658084979437 |
| 24 | 0.12888180959234 | 0.257763619184681 | 0.87111819040766 |
| 25 | 0.147605005275271 | 0.295210010550542 | 0.852394994724729 |
| 26 | 0.294051290819092 | 0.588102581638184 | 0.705948709180908 |
| 27 | 0.223257220494202 | 0.446514440988404 | 0.776742779505798 |
| 28 | 0.487823786794161 | 0.975647573588322 | 0.512176213205839 |
| 29 | 0.511982707679417 | 0.976034584641166 | 0.488017292320583 |
| 30 | 0.542662424816903 | 0.914675150366193 | 0.457337575183097 |
| 31 | 0.49808436964897 | 0.996168739297941 | 0.50191563035103 |
| 32 | 0.747704922177627 | 0.504590155644747 | 0.252295077822373 |
| 33 | 0.804524521887106 | 0.390950956225789 | 0.195475478112894 |
| 34 | 0.72764518792649 | 0.54470962414702 | 0.27235481207351 |
| 35 | 0.753584551906512 | 0.492830896186976 | 0.246415448093488 |
| 36 | 0.680758354778839 | 0.638483290442322 | 0.319241645221161 |
| 37 | 0.612058538109712 | 0.775882923780575 | 0.387941461890287 |
| 38 | 0.693893017131985 | 0.612213965736031 | 0.306106982868015 |
| 39 | 0.720114337308921 | 0.559771325382158 | 0.279885662691079 |
| 40 | 0.619340136011088 | 0.761319727977825 | 0.380659863988912 |
| 41 | 0.630854636766964 | 0.738290726466071 | 0.369145363233036 |
| 42 | 0.612719448075648 | 0.774561103848703 | 0.387280551924352 |
| 43 | 0.621820846367702 | 0.756358307264595 | 0.378179153632298 |
| 44 | 0.589209017874898 | 0.821581964250204 | 0.410790982125102 |
| 45 | 0.589047635490186 | 0.821904729019628 | 0.410952364509814 |
| Meta Analysis of Goldfeld-Quandt test for Heteroskedasticity | |||
| Description | # significant tests | % significant tests | OK/NOK |
| 1% type I error level | 0 | 0 | OK |
| 5% type I error level | 0 | 0 | OK |
| 10% type I error level | 0 | 0 | OK |