| Multiple Linear Regression - Estimated Regression Equation |
| Sales[t] = + 4842.45 -2834.9875M1[t] -1922.825M2[t] -1702.6625M3[t] -1948.9M4[t] -2068.7375M5[t] -2110.575M6[t] -1492.8125M7[t] -1545.05M8[t] -1683.4875M9[t] -1474.925M10[t] -827.5625M11[t] + 10.6375t + e[t] |
| Multiple Linear Regression - Ordinary Least Squares | |||||
| Variable | Parameter | S.D. | T-STAT H0: parameter = 0 | 2-tail p-value | 1-tail p-value |
| (Intercept) | 4842.45 | 177.45941 | 27.2876 | 0 | 0 |
| M1 | -2834.9875 | 215.889303 | -13.1317 | 0 | 0 |
| M2 | -1922.825 | 215.566748 | -8.9199 | 0 | 0 |
| M3 | -1702.6625 | 215.274496 | -7.9093 | 0 | 0 |
| M4 | -1948.9 | 215.01267 | -9.0641 | 0 | 0 |
| M5 | -2068.7375 | 214.781382 | -9.6318 | 0 | 0 |
| M6 | -2110.575 | 214.580731 | -9.8358 | 0 | 0 |
| M7 | -1492.8125 | 214.410803 | -6.9624 | 0 | 0 |
| M8 | -1545.05 | 214.271671 | -7.2107 | 0 | 0 |
| M9 | -1683.4875 | 214.163394 | -7.8608 | 0 | 0 |
| M10 | -1474.925 | 214.08602 | -6.8894 | 0 | 0 |
| M11 | -827.5625 | 214.039582 | -3.8664 | 0.000338 | 0.000169 |
| t | 10.6375 | 2.57431 | 4.1322 | 0.000147 | 7.3e-05 |
| Multiple Linear Regression - Regression Statistics | |
| Multiple R | 0.924371003038483 |
| R-squared | 0.854461751258371 |
| Adjusted R-squared | 0.817303049451997 |
| F-TEST (value) | 22.9949301165256 |
| F-TEST (DF numerator) | 12 |
| F-TEST (DF denominator) | 47 |
| p-value | 1.11022302462516e-15 |
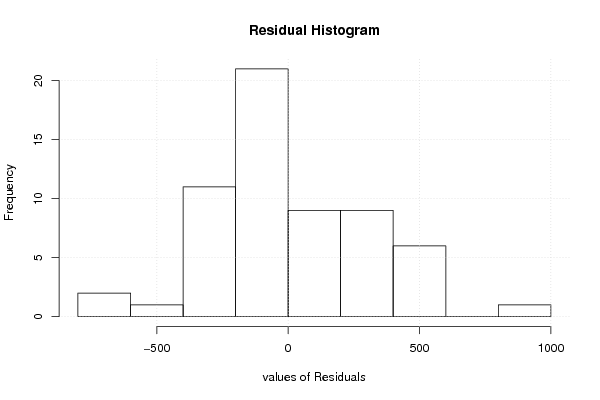
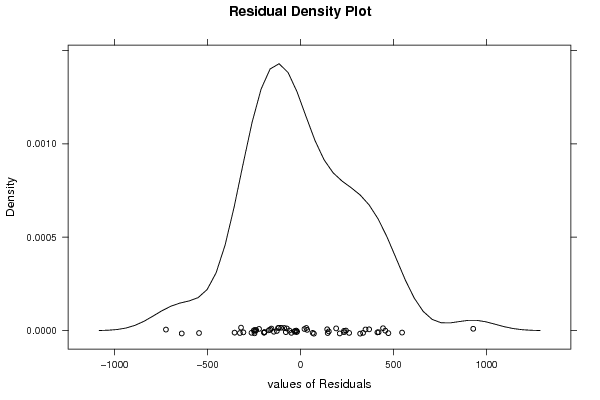
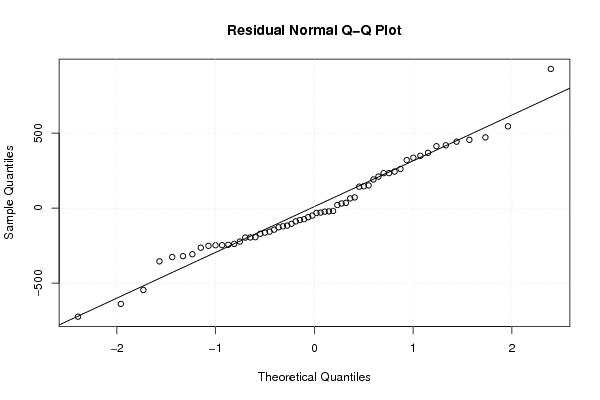
| Multiple Linear Regression - Residual Statistics | |
| Residual Standard Deviation | 338.4018164279 |
| Sum Squared Residuals | 5382242.10000001 |
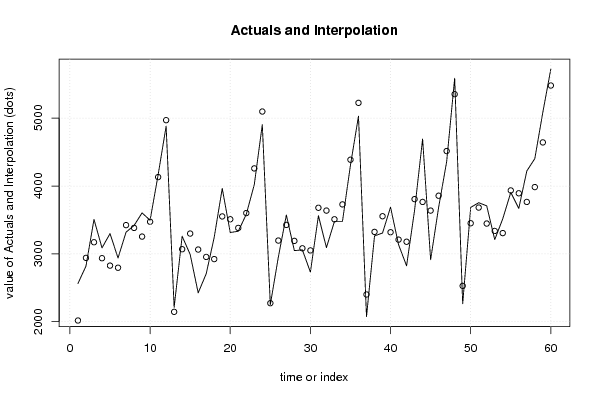
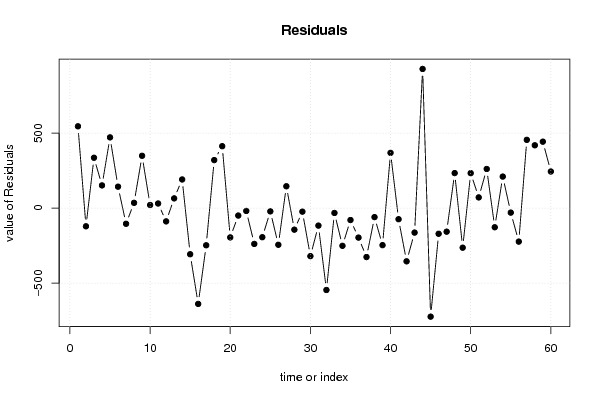
| Multiple Linear Regression - Actuals, Interpolation, and Residuals | |||
| Time or Index | Actuals | Interpolation Forecast | Residuals Prediction Error |
| 1 | 2564 | 2018.09999999999 | 545.900000000009 |
| 2 | 2820 | 2940.9 | -120.900000000001 |
| 3 | 3508 | 3171.7 | 336.3 |
| 4 | 3088 | 2936.1 | 151.9 |
| 5 | 3299 | 2826.9 | 472.1 |
| 6 | 2939 | 2795.7 | 143.3 |
| 7 | 3320 | 3424.1 | -104.1 |
| 8 | 3418 | 3382.5 | 35.4999999999997 |
| 9 | 3604 | 3254.7 | 349.3 |
| 10 | 3495 | 3473.9 | 21.0999999999997 |
| 11 | 4163 | 4131.9 | 31.0999999999996 |
| 12 | 4882 | 4970.1 | -88.1000000000003 |
| 13 | 2211 | 2145.75 | 65.2499999999975 |
| 14 | 3260 | 3068.55 | 191.45 |
| 15 | 2992 | 3299.35 | -307.35 |
| 16 | 2425 | 3063.75 | -638.75 |
| 17 | 2707 | 2954.55 | -247.55 |
| 18 | 3244 | 2923.35 | 320.65 |
| 19 | 3965 | 3551.75 | 413.25 |
| 20 | 3315 | 3510.15 | -195.15 |
| 21 | 3333 | 3382.35 | -49.3500000000003 |
| 22 | 3583 | 3601.55 | -18.5500000000001 |
| 23 | 4021 | 4259.55 | -238.55 |
| 24 | 4904 | 5097.75 | -193.75 |
| 25 | 2252 | 2273.4 | -21.4000000000022 |
| 26 | 2952 | 3196.2 | -244.2 |
| 27 | 3573 | 3427 | 146 |
| 28 | 3048 | 3191.4 | -143.4 |
| 29 | 3059 | 3082.2 | -23.2 |
| 30 | 2731 | 3051 | -320 |
| 31 | 3563 | 3679.4 | -116.4 |
| 32 | 3092 | 3637.8 | -545.8 |
| 33 | 3478 | 3510 | -32.0000000000002 |
| 34 | 3478 | 3729.2 | -251.2 |
| 35 | 4308 | 4387.2 | -79.2000000000001 |
| 36 | 5029 | 5225.4 | -196.4 |
| 37 | 2075 | 2401.05 | -326.050000000002 |
| 38 | 3264 | 3323.85 | -59.8499999999998 |
| 39 | 3308 | 3554.65 | -246.65 |
| 40 | 3688 | 3319.05 | 368.95 |
| 41 | 3136 | 3209.85 | -73.8499999999999 |
| 42 | 2824 | 3178.65 | -354.65 |
| 43 | 3644 | 3807.05 | -163.05 |
| 44 | 4694 | 3765.45 | 928.55 |
| 45 | 2914 | 3637.65 | -723.65 |
| 46 | 3686 | 3856.85 | -170.85 |
| 47 | 4358 | 4514.85 | -156.85 |
| 48 | 5587 | 5353.05 | 233.950000000001 |
| 49 | 2265 | 2528.7 | -263.700000000002 |
| 50 | 3685 | 3451.5 | 233.5 |
| 51 | 3754 | 3682.3 | 71.7000000000003 |
| 52 | 3708 | 3446.7 | 261.3 |
| 53 | 3210 | 3337.5 | -127.5 |
| 54 | 3517 | 3306.3 | 210.7 |
| 55 | 3905 | 3934.7 | -29.6999999999996 |
| 56 | 3670 | 3893.1 | -223.1 |
| 57 | 4221 | 3765.3 | 455.7 |
| 58 | 4404 | 3984.5 | 419.5 |
| 59 | 5086 | 4642.5 | 443.5 |
| 60 | 5725 | 5480.7 | 244.300000000001 |
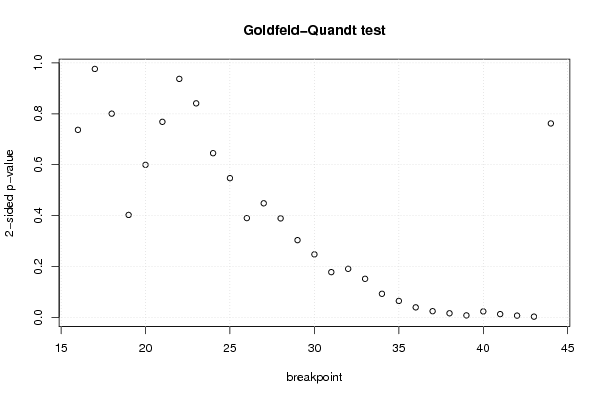
| Goldfeld-Quandt test for Heteroskedasticity | |||
| p-values | Alternative Hypothesis | ||
| breakpoint index | greater | 2-sided | less |
| 16 | 0.63162926889931 | 0.736741462201381 | 0.36837073110069 |
| 17 | 0.511884107476803 | 0.976231785046395 | 0.488115892523197 |
| 18 | 0.599795288895766 | 0.800409422208467 | 0.400204711104234 |
| 19 | 0.79880314817595 | 0.402393703648099 | 0.20119685182405 |
| 20 | 0.700347385457919 | 0.599305229084161 | 0.299652614542081 |
| 21 | 0.615815375447715 | 0.768369249104571 | 0.384184624552285 |
| 22 | 0.531433571960515 | 0.937132856078971 | 0.468566428039485 |
| 23 | 0.420522687485152 | 0.841045374970304 | 0.579477312514848 |
| 24 | 0.322525828708971 | 0.645051657417943 | 0.677474171291029 |
| 25 | 0.273483314342253 | 0.546966628684507 | 0.726516685657747 |
| 26 | 0.194962775906127 | 0.389925551812255 | 0.805037224093873 |
| 27 | 0.224067724119648 | 0.448135448239295 | 0.775932275880352 |
| 28 | 0.194384822210393 | 0.388769644420787 | 0.805615177789607 |
| 29 | 0.151603448514541 | 0.303206897029081 | 0.848396551485459 |
| 30 | 0.123636917867886 | 0.247273835735771 | 0.876363082132114 |
| 31 | 0.0887347713837592 | 0.177469542767518 | 0.911265228616241 |
| 32 | 0.0952386004154986 | 0.190477200830997 | 0.904761399584501 |
| 33 | 0.0755969917964475 | 0.151193983592895 | 0.924403008203553 |
| 34 | 0.0461469581056774 | 0.0922939162113549 | 0.953853041894323 |
| 35 | 0.0320782832160627 | 0.0641565664321254 | 0.967921716783937 |
| 36 | 0.0195209228929891 | 0.0390418457859782 | 0.980479077107011 |
| 37 | 0.011935164353365 | 0.02387032870673 | 0.988064835646635 |
| 38 | 0.0078509815497538 | 0.0157019630995076 | 0.992149018450246 |
| 39 | 0.0037350016977025 | 0.007470003395405 | 0.996264998302298 |
| 40 | 0.0114817299938844 | 0.0229634599877688 | 0.988518270006116 |
| 41 | 0.00617382376439626 | 0.0123476475287925 | 0.993826176235604 |
| 42 | 0.0032609281906081 | 0.00652185638121621 | 0.996739071809392 |
| 43 | 0.00121809334841198 | 0.00243618669682396 | 0.998781906651588 |
| 44 | 0.381012442091159 | 0.762024884182318 | 0.618987557908841 |
| Meta Analysis of Goldfeld-Quandt test for Heteroskedasticity | |||
| Description | # significant tests | % significant tests | OK/NOK |
| 1% type I error level | 3 | 0.103448275862069 | NOK |
| 5% type I error level | 8 | 0.275862068965517 | NOK |
| 10% type I error level | 10 | 0.344827586206897 | NOK |