| Multiple Linear Regression - Estimated Regression Equation |
| TimeIN[t] = -589.153131937757 + 0.853868269729681Temp[t] + 0.660291099516269Sunset[t] -13.7972323210149Rain[t] + 0.02404201437702Day[t] + e[t] |
| Multiple Linear Regression - Ordinary Least Squares | |||||
| Variable | Parameter | S.D. | T-STAT H0: parameter = 0 | 2-tail p-value | 1-tail p-value |
| (Intercept) | -589.153131937757 | 498.708881 | -1.1814 | 0.247059 | 0.123529 |
| Temp | 0.853868269729681 | 0.381145 | 2.2403 | 0.032902 | 0.016451 |
| Sunset | 0.660291099516269 | 0.137715 | 4.7946 | 4.5e-05 | 2.2e-05 |
| Rain | -13.7972323210149 | 5.331388 | -2.5879 | 0.014932 | 0.007466 |
| Day | 0.02404201437702 | 0.010528 | 2.2836 | 0.029904 | 0.014952 |
| Multiple Linear Regression - Regression Statistics | |
| Multiple R | 0.816370605487054 |
| R-squared | 0.6664609655033 |
| Adjusted R-squared | 0.620455581434789 |
| F-TEST (value) | 14.4865862767457 |
| F-TEST (DF numerator) | 4 |
| F-TEST (DF denominator) | 29 |
| p-value | 1.29877506571674e-06 |
| Multiple Linear Regression - Residual Statistics | |
| Residual Standard Deviation | 10.0629817155652 |
| Sum Squared Residuals | 2936.64442922621 |
| Multiple Linear Regression - Actuals, Interpolation, and Residuals | |||
| Time or Index | Actuals | Interpolation Forecast | Residuals Prediction Error |
| 1 | 1225 | 1216.84661321968 | 8.15338678031521 |
| 2 | 1214 | 1219.11351625163 | -5.11351625162615 |
| 3 | 1205 | 1218.84161799065 | -13.8416179906463 |
| 4 | 1196 | 1215.81453775026 | -19.8145377502639 |
| 5 | 1209 | 1192.60901668216 | 16.3909833178385 |
| 6 | 1192 | 1200.39062981874 | -8.39062981874016 |
| 7 | 1196 | 1187.85846212226 | 8.14153787774124 |
| 8 | 1174 | 1183.7441566475 | -9.7441566474953 |
| 9 | 1183 | 1197.84439498007 | -14.8443949800736 |
| 10 | 1210 | 1199.4510069125 | 10.548993087501 |
| 11 | 1205 | 1201.12020215563 | 3.8797978443701 |
| 12 | 1218 | 1204.00761649265 | 13.9923835073502 |
| 13 | 1224 | 1208.77807510685 | 15.2219248931514 |
| 14 | 1215 | 1211.38652544668 | 3.61347455331783 |
| 15 | 1206 | 1204.45445468181 | 1.54554531818925 |
| 16 | 1202 | 1198.09728818948 | 3.90271181051736 |
| 17 | 1215 | 1196.80074800483 | 18.1992519951729 |
| 18 | 1203 | 1198.83429407212 | 4.16570592788264 |
| 19 | 1194 | 1198.71036594882 | -4.71036594881592 |
| 20 | 1170 | 1184.95415192035 | -14.9541519203486 |
| 21 | 1184 | 1183.83421262774 | 0.165787372264091 |
| 22 | 1199 | 1197.35954668777 | 1.64045331222907 |
| 23 | 1196 | 1196.06300650312 | -0.0630065031154115 |
| 24 | 1189 | 1190.64509510749 | -1.64509510748994 |
| 25 | 1185 | 1192.32135608683 | -7.32135608682731 |
| 26 | 1192 | 1190.31891777012 | 1.68108222987942 |
| 27 | 1188 | 1187.05848056509 | 0.94151943491321 |
| 28 | 1176 | 1185.05604224838 | -9.05604224838005 |
| 29 | 1177 | 1180.07213072383 | -3.07213072382591 |
| 30 | 1166 | 1176.10579538674 | -10.1057953867409 |
| 31 | 1176 | 1171.21847438545 | 4.78152561455286 |
| 32 | 1181 | 1174.42463251409 | 6.57536748590854 |
| 33 | 1176 | 1172.10345040576 | 3.89654959423968 |
| 34 | 1172 | 1176.76118459295 | -4.76118459294509 |
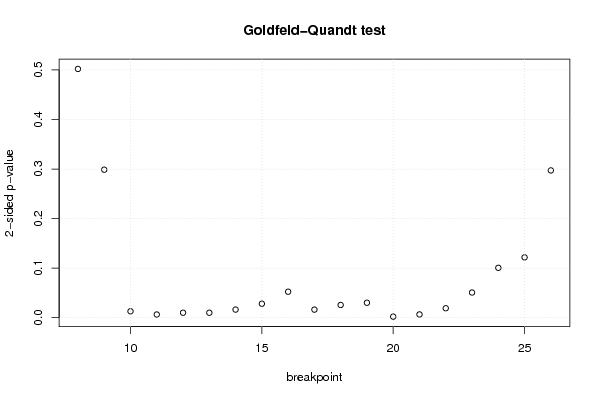
| Goldfeld-Quandt test for Heteroskedasticity | |||
| p-values | Alternative Hypothesis | ||
| breakpoint index | greater | 2-sided | less |
| 8 | 0.250980952896323 | 0.501961905792647 | 0.749019047103677 |
| 9 | 0.850683468036885 | 0.298633063926231 | 0.149316531963115 |
| 10 | 0.993532934048888 | 0.0129341319022235 | 0.00646706595111173 |
| 11 | 0.996782665216201 | 0.00643466956759809 | 0.00321733478379904 |
| 12 | 0.994990166903642 | 0.0100196661927151 | 0.00500983309635757 |
| 13 | 0.994996116868518 | 0.0100077662629649 | 0.00500388313148246 |
| 14 | 0.991825170811959 | 0.0163496583760827 | 0.00817482918804133 |
| 15 | 0.985907534578216 | 0.0281849308435685 | 0.0140924654217842 |
| 16 | 0.973803822017337 | 0.0523923559653266 | 0.0261961779826633 |
| 17 | 0.991869120191646 | 0.0162617596167082 | 0.00813087980835411 |
| 18 | 0.987157039380977 | 0.0256859212380455 | 0.0128429606190228 |
| 19 | 0.984915028602802 | 0.0301699427943963 | 0.0150849713971981 |
| 20 | 0.998945562377406 | 0.00210887524518785 | 0.00105443762259393 |
| 21 | 0.99671454425156 | 0.00657091149688015 | 0.00328545574844008 |
| 22 | 0.9904441839317 | 0.0191116321366005 | 0.00955581606830024 |
| 23 | 0.974593639630431 | 0.0508127207391378 | 0.0254063603695689 |
| 24 | 0.949673138685268 | 0.100653722629465 | 0.0503268613147323 |
| 25 | 0.939108063924422 | 0.121783872151157 | 0.0608919360755784 |
| 26 | 0.851402807373134 | 0.297194385253732 | 0.148597192626866 |
| Meta Analysis of Goldfeld-Quandt test for Heteroskedasticity | |||
| Description | # significant tests | % significant tests | OK/NOK |
| 1% type I error level | 3 | 0.157894736842105 | NOK |
| 5% type I error level | 12 | 0.631578947368421 | NOK |
| 10% type I error level | 14 | 0.736842105263158 | NOK |