| Multiple Linear Regression - Estimated Regression Equation |
| Sat[t] = + 48.7716447324039 -0.0329259567701882Age[t] -1.54456830512478MF[t] -0.462010688776791Rm[t] + 3.31334019308661PubPr[t] + 1.18532954135618LOS[t] -0.188414089256728OorG[t] + 2.14873852674129type[t] -0.333101201099572`wr `[t] + e[t] |
| Multiple Linear Regression - Ordinary Least Squares | |||||
| Variable | Parameter | S.D. | T-STAT H0: parameter = 0 | 2-tail p-value | 1-tail p-value |
| (Intercept) | 48.7716447324039 | 8.495137 | 5.7411 | 1e-06 | 0 |
| Age | -0.0329259567701882 | 0.07281 | -0.4522 | 0.653194 | 0.326597 |
| MF | -1.54456830512478 | 2.37937 | -0.6492 | 0.519401 | 0.259701 |
| Rm | -0.462010688776791 | 1.042953 | -0.443 | 0.65981 | 0.329905 |
| PubPr | 3.31334019308661 | 2.593253 | 1.2777 | 0.207638 | 0.103819 |
| LOS | 1.18532954135618 | 0.669969 | 1.7692 | 0.083344 | 0.041672 |
| OorG | -0.188414089256728 | 2.631239 | -0.0716 | 0.943219 | 0.471609 |
| type | 2.14873852674129 | 2.622467 | 0.8194 | 0.416718 | 0.208359 |
| `wr ` | -0.333101201099572 | 0.936702 | -0.3556 | 0.723723 | 0.361862 |
| Multiple Linear Regression - Regression Statistics | |
| Multiple R | 0.354064251111079 |
| R-squared | 0.125361493914849 |
| Adjusted R-squared | -0.0235131454187933 |
| F-TEST (value) | 0.842060773251661 |
| F-TEST (DF numerator) | 8 |
| F-TEST (DF denominator) | 47 |
| p-value | 0.570853717890965 |
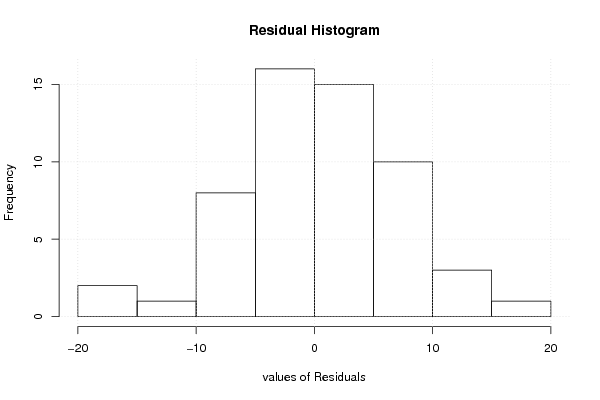
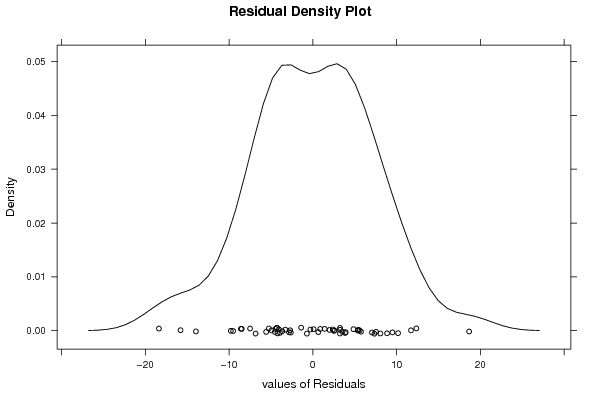
| Multiple Linear Regression - Residual Statistics | |
| Residual Standard Deviation | 7.79841587553479 |
| Sum Squared Residuals | 2858.31863788627 |
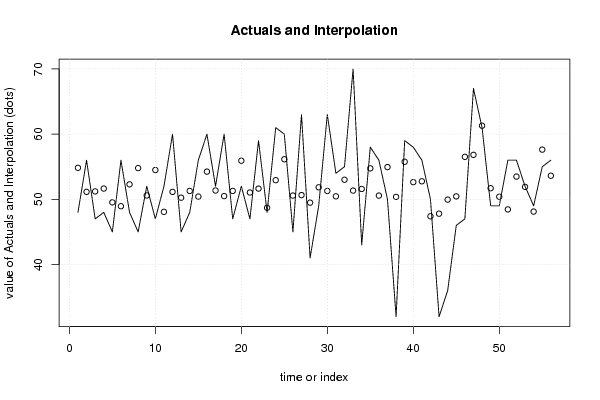
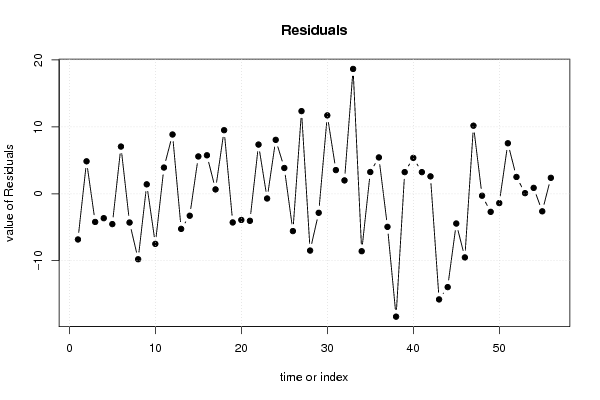
| Multiple Linear Regression - Actuals, Interpolation, and Residuals | |||
| Time or Index | Actuals | Interpolation Forecast | Residuals Prediction Error |
| 1 | 48 | 54.832048240279 | -6.83204824027897 |
| 2 | 56 | 51.1473074522038 | 4.85269254779624 |
| 3 | 47 | 51.2133544870231 | -4.21335448702315 |
| 4 | 48 | 51.6518476307946 | -3.65184763079456 |
| 5 | 45 | 49.5360350608235 | -4.53603506082346 |
| 6 | 56 | 48.9433727413307 | 7.05662725866934 |
| 7 | 48 | 52.2988637664452 | -4.2988637664452 |
| 8 | 45 | 54.7890550402771 | -9.78905504027711 |
| 9 | 52 | 50.5896656774695 | 1.41033432253053 |
| 10 | 47 | 54.4918265566512 | -7.49182655665118 |
| 11 | 52 | 48.0813567415492 | 3.91864325845083 |
| 12 | 60 | 51.140514155732 | 8.85948584426798 |
| 13 | 45 | 50.2515182253075 | -5.25151822530753 |
| 14 | 48 | 51.2837258849365 | -3.28372588493649 |
| 15 | 56 | 50.4192947935115 | 5.58070520648846 |
| 16 | 60 | 54.2491467775005 | 5.75085322249946 |
| 17 | 52 | 51.3495777984769 | 0.650422201523139 |
| 18 | 60 | 50.4935078248226 | 9.50649217517743 |
| 19 | 47 | 51.2868726692896 | -4.28687266928955 |
| 20 | 52 | 55.9179099646506 | -3.91790996465058 |
| 21 | 47 | 51.0448879721451 | -4.04488797214511 |
| 22 | 59 | 51.6441643639992 | 7.35583563600082 |
| 23 | 48 | 48.7052028747734 | -0.705202874773368 |
| 24 | 61 | 52.9375230967218 | 8.06247690327821 |
| 25 | 60 | 56.1464445929829 | 3.85355540701709 |
| 26 | 45 | 50.5769361596117 | -5.57693615961172 |
| 27 | 63 | 50.644887563511 | 12.355112436489 |
| 28 | 41 | 49.4903795861955 | -8.49037958619551 |
| 29 | 49 | 51.8427723009851 | -2.84277230098506 |
| 30 | 63 | 51.2813596341772 | 11.7186403658228 |
| 31 | 54 | 50.4611574756259 | 3.53884252437407 |
| 32 | 55 | 53.0050074836095 | 1.99499251639052 |
| 33 | 70 | 51.3400861628187 | 18.6599138371813 |
| 34 | 43 | 51.589196244862 | -8.58919624486198 |
| 35 | 58 | 54.7471315293554 | 3.25286847064461 |
| 36 | 56 | 50.5684964873567 | 5.43150351264325 |
| 37 | 50 | 54.9446872699765 | -4.94468726997652 |
| 38 | 32 | 50.3709407467356 | -18.3709407467356 |
| 39 | 59 | 55.7613745381699 | 3.23862546183012 |
| 40 | 58 | 52.6344657437374 | 5.36553425626265 |
| 41 | 56 | 52.765122276824 | 3.23487772317605 |
| 42 | 50 | 47.3990582031102 | 2.60094179688978 |
| 43 | 32 | 47.7941696843525 | -15.7941696843525 |
| 44 | 36 | 49.9549008559061 | -13.9549008559061 |
| 45 | 46 | 50.4496276730623 | -4.44962767306226 |
| 46 | 47 | 56.5186711868718 | -9.51867118687178 |
| 47 | 67 | 56.8221252803317 | 10.1778747196683 |
| 48 | 61 | 61.291020744728 | -0.291020744727972 |
| 49 | 49 | 51.7039608146825 | -2.70396081468248 |
| 50 | 49 | 50.3923369009421 | -1.39233690094214 |
| 51 | 56 | 48.4497152562422 | 7.55028474375777 |
| 52 | 56 | 53.4873670325986 | 2.51263296740137 |
| 53 | 52 | 51.9069260100002 | 0.093073989999803 |
| 54 | 49 | 48.1204556885403 | 0.879544311459653 |
| 55 | 55 | 57.6245149764068 | -2.62451497640683 |
| 56 | 56 | 53.6161240989759 | 2.38387590102408 |
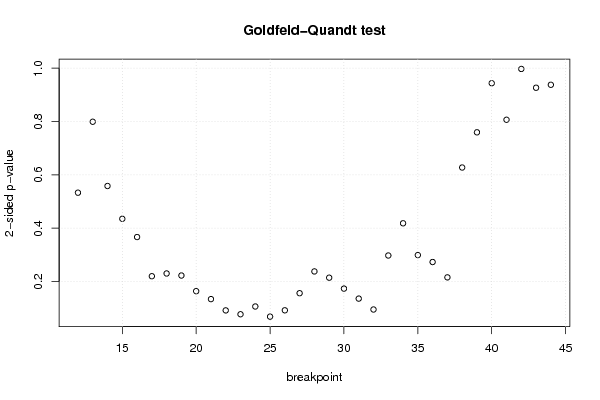
| Goldfeld-Quandt test for Heteroskedasticity | |||
| p-values | Alternative Hypothesis | ||
| breakpoint index | greater | 2-sided | less |
| 12 | 0.266571474917888 | 0.533142949835777 | 0.733428525082112 |
| 13 | 0.399622397801117 | 0.799244795602234 | 0.600377602198883 |
| 14 | 0.279145925479964 | 0.558291850959927 | 0.720854074520036 |
| 15 | 0.217620809981041 | 0.435241619962083 | 0.782379190018959 |
| 16 | 0.183425423625557 | 0.366850847251114 | 0.816574576374443 |
| 17 | 0.109965199537896 | 0.219930399075792 | 0.890034800462104 |
| 18 | 0.115086914963588 | 0.230173829927177 | 0.884913085036412 |
| 19 | 0.111293234498684 | 0.222586468997368 | 0.888706765501316 |
| 20 | 0.0819192557674437 | 0.163838511534887 | 0.918080744232556 |
| 21 | 0.0670519003542013 | 0.134103800708403 | 0.932948099645799 |
| 22 | 0.0458825738949691 | 0.0917651477899382 | 0.954117426105031 |
| 23 | 0.0386232919053569 | 0.0772465838107138 | 0.961376708094643 |
| 24 | 0.0531950475877376 | 0.106390095175475 | 0.946804952412262 |
| 25 | 0.0341406524705728 | 0.0682813049411455 | 0.965859347529427 |
| 26 | 0.0460599814478109 | 0.0921199628956219 | 0.953940018552189 |
| 27 | 0.0780938031962739 | 0.156187606392548 | 0.921906196803726 |
| 28 | 0.118959051108651 | 0.237918102217302 | 0.881040948891349 |
| 29 | 0.107175679070781 | 0.214351358141561 | 0.892824320929219 |
| 30 | 0.0867454549780464 | 0.173490909956093 | 0.913254545021954 |
| 31 | 0.0679795395698259 | 0.135959079139652 | 0.932020460430174 |
| 32 | 0.0475460293291161 | 0.0950920586582322 | 0.952453970670884 |
| 33 | 0.148803670522008 | 0.297607341044015 | 0.851196329477992 |
| 34 | 0.209219471078992 | 0.418438942157984 | 0.790780528921008 |
| 35 | 0.149570060916446 | 0.299140121832893 | 0.850429939083554 |
| 36 | 0.13660402992852 | 0.27320805985704 | 0.86339597007148 |
| 37 | 0.107814043736658 | 0.215628087473315 | 0.892185956263342 |
| 38 | 0.686199659202014 | 0.627600681595971 | 0.313800340797986 |
| 39 | 0.620194363961597 | 0.759611272076807 | 0.379805636038404 |
| 40 | 0.52814744272953 | 0.94370511454094 | 0.47185255727047 |
| 41 | 0.403374449184084 | 0.806748898368168 | 0.596625550815916 |
| 42 | 0.498620673309765 | 0.99724134661953 | 0.501379326690235 |
| 43 | 0.463358176932463 | 0.926716353864927 | 0.536641823067537 |
| 44 | 0.53106436326342 | 0.937871273473161 | 0.46893563673658 |
| Meta Analysis of Goldfeld-Quandt test for Heteroskedasticity | |||
| Description | # significant tests | % significant tests | OK/NOK |
| 1% type I error level | 0 | 0 | OK |
| 5% type I error level | 0 | 0 | OK |
| 10% type I error level | 5 | 0.151515151515152 | NOK |