| Tabulation of Results | ||||
| Connected x Depression | ||||
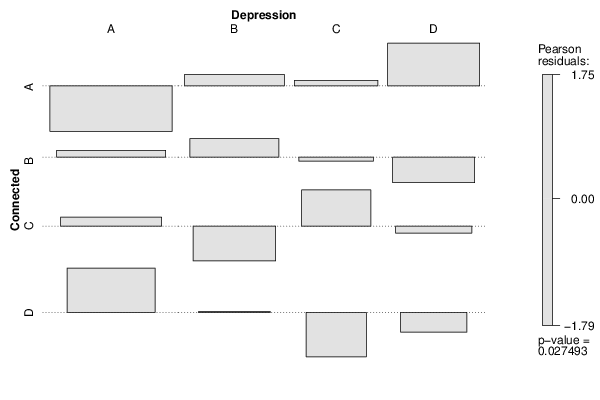
| A | B | C | D | A | 12 | 15 | 10 | 17 | B | 17 | 13 | 7 | 6 | C | 15 | 5 | 10 | 7 | D | 16 | 7 | 1 | 4 |
| Tabulation of Expected Results | ||||
| Connected x Depression | ||||
| A | B | C | D | A | 20 | 13.33 | 9.33 | 11.33 | B | 15.93 | 10.62 | 7.43 | 9.02 | C | 13.7 | 9.14 | 6.4 | 7.77 | D | 10.37 | 6.91 | 4.84 | 5.88 |
| Statistical Results | |
| Pearson's Chi-squared test | |
| Pearson Chi Square Statistic | 18.74 |
| Degrees of Freedom | 9 |
| P value | 0.03 |