| Multiple Linear Regression - Estimated Regression Equation |
| Verkoopprijs[t] = -8983283.75084861 + 58.9134476166073Oppervlakte[t] + 1453.40556005067Bewoonbareoppervlakte[t] -36851.488550221Slaapkamers[t] + 4563.5068813388Bouwjaar[t] + 3533.55024630607t + e[t] |
| Multiple Linear Regression - Ordinary Least Squares | |||||
| Variable | Parameter | S.D. | T-STAT H0: parameter = 0 | 2-tail p-value | 1-tail p-value |
| (Intercept) | -8983283.75084861 | 2572965.395789 | -3.4914 | 0.000966 | 0.000483 |
| Oppervlakte | 58.9134476166073 | 14.701281 | 4.0074 | 0.00019 | 9.5e-05 |
| Bewoonbareoppervlakte | 1453.40556005067 | 204.833985 | 7.0955 | 0 | 0 |
| Slaapkamers | -36851.488550221 | 24240.777845 | -1.5202 | 0.134288 | 0.067144 |
| Bouwjaar | 4563.5068813388 | 1297.260703 | 3.5178 | 0.000891 | 0.000446 |
| t | 3533.55024630607 | 1171.315868 | 3.0167 | 0.003891 | 0.001946 |
| Multiple Linear Regression - Regression Statistics | |
| Multiple R | 0.87341958015454 |
| R-squared | 0.762861762997332 |
| Adjusted R-squared | 0.740904518830419 |
| F-TEST (value) | 34.7430559681461 |
| F-TEST (DF numerator) | 5 |
| F-TEST (DF denominator) | 54 |
| p-value | 9.99200722162641e-16 |
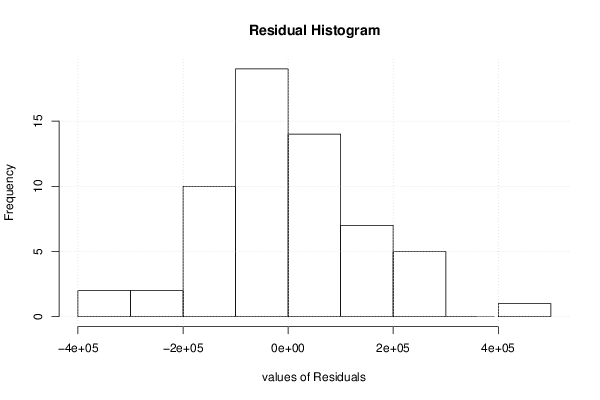
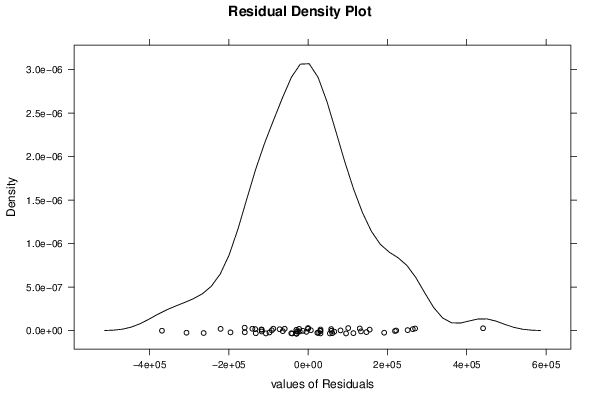
| Multiple Linear Regression - Residual Statistics | |
| Residual Standard Deviation | 153274.623043412 |
| Sum Squared Residuals | 1268627943731.4 |
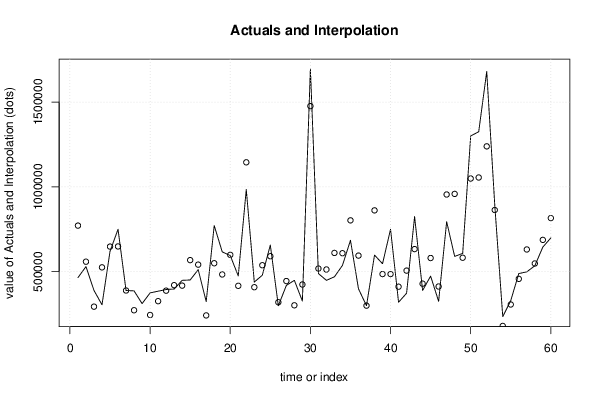
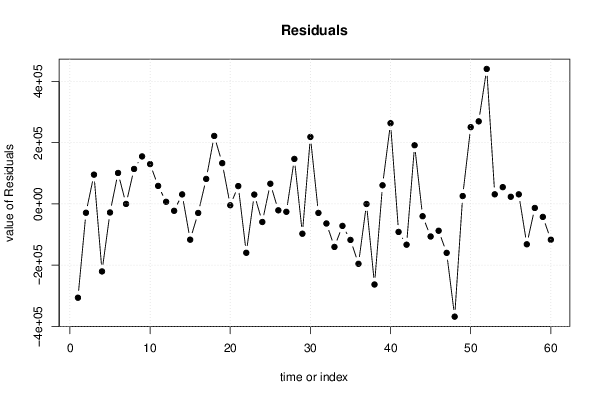
| Multiple Linear Regression - Actuals, Interpolation, and Residuals | |||
| Time or Index | Actuals | Interpolation Forecast | Residuals Prediction Error |
| 1 | 465000 | 771660.727919615 | -306660.727919615 |
| 2 | 530000 | 558921.726632243 | -28921.7266322426 |
| 3 | 389500 | 293846.750492023 | 95653.2495079769 |
| 4 | 305000 | 525705.852736031 | -220705.852736031 |
| 5 | 620000 | 647998.414349088 | -27998.4143490883 |
| 6 | 750000 | 648851.261908024 | 101148.738091976 |
| 7 | 389000 | 389078.265777997 | -78.2657779969298 |
| 8 | 387000 | 272763.686607873 | 114236.313392127 |
| 9 | 312000 | 156709.957890862 | 155290.042109138 |
| 10 | 375000 | 244774.637160021 | 130225.362839979 |
| 11 | 385000 | 326184.573459389 | 58815.4265406109 |
| 12 | 395000 | 388088.3099829 | 6911.69001709996 |
| 13 | 398000 | 420518.470517397 | -22518.4705173975 |
| 14 | 449000 | 417890.397162678 | 31109.6028373217 |
| 15 | 451245 | 568161.823486195 | -116916.823486195 |
| 16 | 511862 | 541510.358394927 | -29648.3583949265 |
| 17 | 324000 | 242283.76787108 | 81716.2321289205 |
| 18 | 772000 | 549819.23987014 | 222180.76012986 |
| 19 | 617000 | 483748.290295844 | 133251.709704156 |
| 20 | 595000 | 599369.727809415 | -4369.72780941498 |
| 21 | 475000 | 416734.829472234 | 58265.1705277664 |
| 22 | 985000 | 1144724.75563993 | -159724.755639925 |
| 23 | 439000 | 408495.057385165 | 30504.9426148351 |
| 24 | 479000 | 538087.961306105 | -59087.9613061051 |
| 25 | 657160 | 591207.201058645 | 65952.7989413546 |
| 26 | 299000 | 319952.11199452 | -20952.1119945203 |
| 27 | 419000 | 444781.59081093 | -25781.5908109299 |
| 28 | 449000 | 301881.624824124 | 147118.375175876 |
| 29 | 327000 | 424439.762089858 | -97439.7620898583 |
| 30 | 1695000 | 1475974.8609735 | 219025.139026496 |
| 31 | 489000 | 518433.476109778 | -29433.4761097779 |
| 32 | 449000 | 513001.895211442 | -64001.8952114423 |
| 33 | 470000 | 610596.369594978 | -140596.369594978 |
| 34 | 537000 | 608873.068956898 | -71873.0689568983 |
| 35 | 685000 | 802691.330719342 | -117691.330719342 |
| 36 | 399000 | 594771.155614986 | -195771.155614986 |
| 37 | 299500 | 299813.536835749 | -313.536835748702 |
| 38 | 598000 | 861466.823907299 | -263466.823907299 |
| 39 | 547000 | 486129.009024492 | 60870.9909755084 |
| 40 | 750000 | 486112.525424983 | 263887.474575017 |
| 41 | 320000 | 411558.660946079 | -91558.6609460785 |
| 42 | 373000 | 506291.475791247 | -133291.475791247 |
| 43 | 825000 | 633174.603330206 | 191825.396669794 |
| 44 | 389000 | 429258.50321405 | -40258.5032140495 |
| 45 | 474000 | 580520.023350284 | -106520.023350284 |
| 46 | 325000 | 412745.142637662 | -87745.1426376615 |
| 47 | 795000 | 955002.168346926 | -160002.168346926 |
| 48 | 590000 | 958533.560348954 | -368533.560348954 |
| 49 | 608000 | 582252.48535831 | 25747.5146416898 |
| 50 | 1300000 | 1049098.46648796 | 250901.533512037 |
| 51 | 1325000 | 1055160.94637378 | 269839.053626224 |
| 52 | 1680000 | 1238806.10592515 | 441193.894074851 |
| 53 | 895000 | 863610.413668187 | 31389.5863318133 |
| 54 | 235000 | 180209.938123347 | 54790.0618766531 |
| 55 | 330000 | 306652.296429989 | 23347.703570011 |
| 56 | 489000 | 457760.582970733 | 31239.4170292672 |
| 57 | 499000 | 630942.166605977 | -131942.166605977 |
| 58 | 535000 | 548220.146548117 | -13220.1465481172 |
| 59 | 645000 | 687472.054975586 | -42472.0549755859 |
| 60 | 699000 | 815942.07128876 | -116942.07128876 |
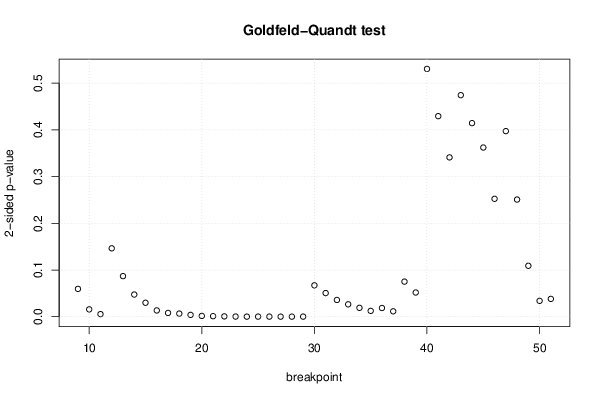
| Goldfeld-Quandt test for Heteroskedasticity | |||
| p-values | Alternative Hypothesis | ||
| breakpoint index | greater | 2-sided | less |
| 9 | 0.0297844166193503 | 0.0595688332387005 | 0.97021558338065 |
| 10 | 0.00786415533088684 | 0.0157283106617737 | 0.992135844669113 |
| 11 | 0.00277420710309103 | 0.00554841420618205 | 0.997225792896909 |
| 12 | 0.073214857347741 | 0.146429714695482 | 0.926785142652259 |
| 13 | 0.0434326255915587 | 0.0868652511831174 | 0.956567374408441 |
| 14 | 0.0237396476262383 | 0.0474792952524767 | 0.976260352373762 |
| 15 | 0.0149376778833945 | 0.0298753557667889 | 0.985062322116605 |
| 16 | 0.00671069295463588 | 0.0134213859092718 | 0.993289307045364 |
| 17 | 0.0040054811918759 | 0.00801096238375179 | 0.995994518808124 |
| 18 | 0.00330707046890872 | 0.00661414093781744 | 0.996692929531091 |
| 19 | 0.00196067229168692 | 0.00392134458337385 | 0.998039327708313 |
| 20 | 0.000842119954478289 | 0.00168423990895658 | 0.999157880045522 |
| 21 | 0.000560861057607567 | 0.00112172211521513 | 0.999439138942392 |
| 22 | 0.000357532128681344 | 0.000715064257362689 | 0.999642467871319 |
| 23 | 0.000150027090085863 | 0.000300054180171725 | 0.999849972909914 |
| 24 | 7.35841966926689e-05 | 0.000147168393385338 | 0.999926415803307 |
| 25 | 9.85792690378606e-05 | 0.000197158538075721 | 0.999901420730962 |
| 26 | 8.33121753246508e-05 | 0.000166624350649302 | 0.999916687824675 |
| 27 | 5.59787936841474e-05 | 0.000111957587368295 | 0.999944021206316 |
| 28 | 5.59398159796344e-05 | 0.000111879631959269 | 0.99994406018402 |
| 29 | 8.81294847077374e-05 | 0.000176258969415475 | 0.999911870515292 |
| 30 | 0.0335905019732696 | 0.0671810039465392 | 0.96640949802673 |
| 31 | 0.0252904949747881 | 0.0505809899495761 | 0.974709505025212 |
| 32 | 0.0179378927243358 | 0.0358757854486715 | 0.982062107275664 |
| 33 | 0.0132594717326637 | 0.0265189434653275 | 0.986740528267336 |
| 34 | 0.00950189976522648 | 0.019003799530453 | 0.990498100234773 |
| 35 | 0.00624400637207631 | 0.0124880127441526 | 0.993755993627924 |
| 36 | 0.00930428315153409 | 0.0186085663030682 | 0.990695716848466 |
| 37 | 0.00579022147594953 | 0.0115804429518991 | 0.99420977852405 |
| 38 | 0.0375541597125184 | 0.0751083194250367 | 0.962445840287482 |
| 39 | 0.0258871819752322 | 0.0517743639504644 | 0.974112818024768 |
| 40 | 0.265212269538443 | 0.530424539076885 | 0.734787730461557 |
| 41 | 0.214667346011922 | 0.429334692023845 | 0.785332653988078 |
| 42 | 0.170545498334668 | 0.341090996669336 | 0.829454501665332 |
| 43 | 0.237135012674772 | 0.474270025349544 | 0.762864987325228 |
| 44 | 0.207223579527982 | 0.414447159055963 | 0.792776420472018 |
| 45 | 0.18110068893064 | 0.36220137786128 | 0.81889931106936 |
| 46 | 0.126213227026619 | 0.252426454053238 | 0.873786772973381 |
| 47 | 0.801340851966583 | 0.397318296066834 | 0.198659148033417 |
| 48 | 0.874588508832889 | 0.250822982334222 | 0.125411491167111 |
| 49 | 0.945493250670138 | 0.109013498659724 | 0.0545067493298621 |
| 50 | 0.983015598380335 | 0.0339688032393305 | 0.0169844016196653 |
| 51 | 0.980932619020509 | 0.0381347619589827 | 0.0190673809794913 |
| Meta Analysis of Goldfeld-Quandt test for Heteroskedasticity | |||
| Description | # significant tests | % significant tests | OK/NOK |
| 1% type I error level | 14 | 0.325581395348837 | NOK |
| 5% type I error level | 26 | 0.604651162790698 | NOK |
| 10% type I error level | 32 | 0.744186046511628 | NOK |