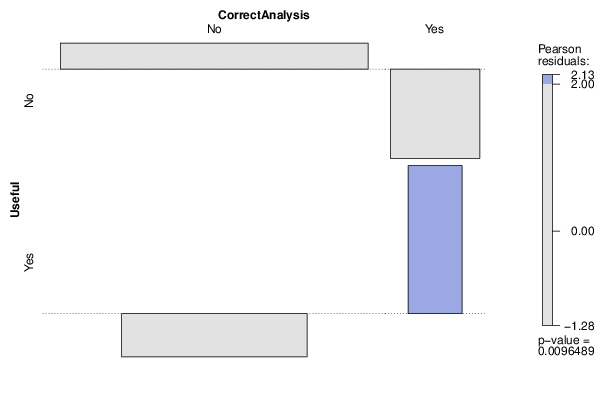
| Tabulation of Results | ||
| Useful x CorrectAnalysis | ||
| No | Yes | No | 108 | 5 | Yes | 34 | 7 |
| Tabulation of Expected Results | ||
| Useful x CorrectAnalysis | ||
| No | Yes | No | 104.19 | 8.81 | Yes | 37.81 | 3.19 |
| Statistical Results | |
| Pearson's Chi-squared test with Yates' continuity correction | |
| Pearson Chi Square Statistic | 5.05 |
| Degrees of Freedom | 1 |
| P value | 0.02 |