| Tabulation of Results | ||
| T40 x Used | ||
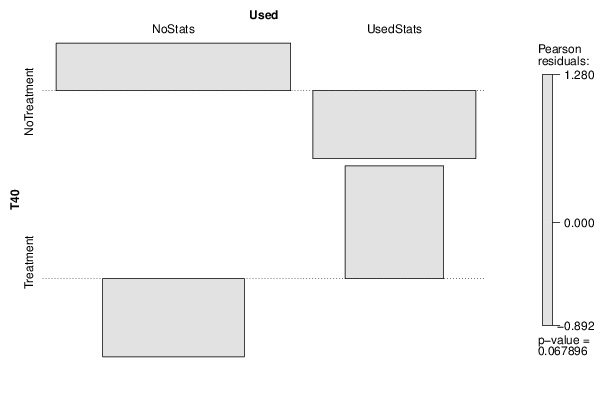
| NoStats | UsedStats | NoTreatment | 46 | 17 | Treatment | 12 | 11 |
| Tabulation of Expected Results | ||
| T40 x Used | ||
| NoStats | UsedStats | NoTreatment | 42.49 | 20.51 | Treatment | 15.51 | 7.49 |
| Statistical Results | |
| Pearson's Chi-squared test with simulated p-value (based on 2000 replicates) | |
| Exact Pearson Chi Square Statistic | 3.33 |
| P value | 0.07 |