| Tabulation of Results | ||
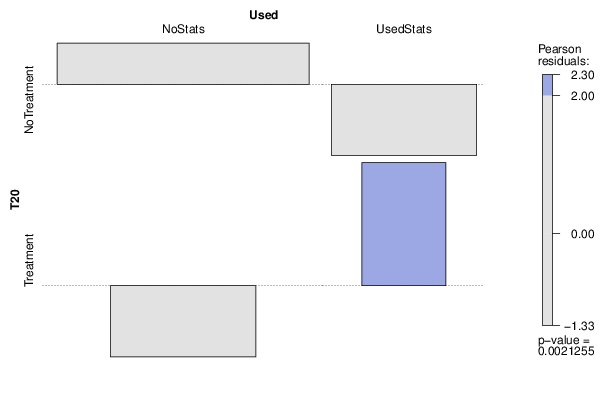
| T20 x Used | ||
| NoStats | UsedStats | NoTreatment | 43 | 8 | Treatment | 8 | 9 |
| Tabulation of Expected Results | ||
| T20 x Used | ||
| NoStats | UsedStats | NoTreatment | 38.25 | 12.75 | Treatment | 12.75 | 4.25 |
| Statistical Results | |
| Pearson's Chi-squared test with simulated p-value (based on 2000 replicates) | |
| Exact Pearson Chi Square Statistic | 9.44 |
| P value | 0 |