| Tabulation of Results | ||
| T40 x CorrectAnalysis | ||
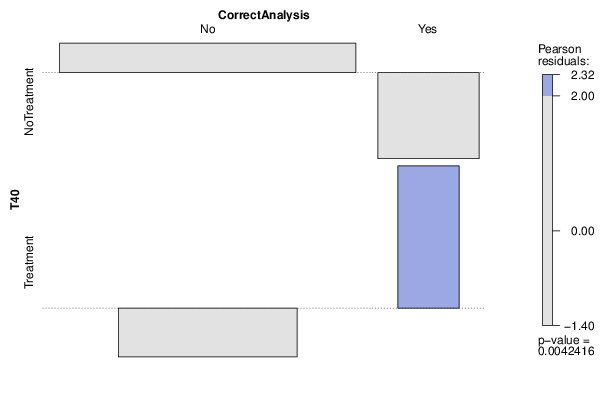
| No | Yes | NoTreatment | 60 | 3 | Treatment | 17 | 6 |
| Tabulation of Expected Results | ||
| T40 x CorrectAnalysis | ||
| No | Yes | NoTreatment | 56.41 | 6.59 | Treatment | 20.59 | 2.41 |
| Statistical Results | |
| Pearson's Chi-squared test with simulated p-value (based on 2000 replicates) | |
| Exact Pearson Chi Square Statistic | 8.18 |
| P value | 0.01 |