| Tabulation of Results | |||||
| 1 x 2 | |||||
| 1 | 2 | 3 | 4 | 6 | 2 | 0 | 0 | 1 | 1 | 0 | 3 | 0 | 1 | 0 | 0 | 0 | 4 | 0 | 0 | 0 | 0 | 1 | 5 | 1 | 0 | 0 | 0 | 1 |
| Tabulation of Expected Results | |||||
| 1 x 2 | |||||
| 1 | 2 | 3 | 4 | 6 | 2 | 0.33 | 0.33 | 0.33 | 0.33 | 0.67 | 3 | 0.17 | 0.17 | 0.17 | 0.17 | 0.33 | 4 | 0.17 | 0.17 | 0.17 | 0.17 | 0.33 | 5 | 0.33 | 0.33 | 0.33 | 0.33 | 0.67 |
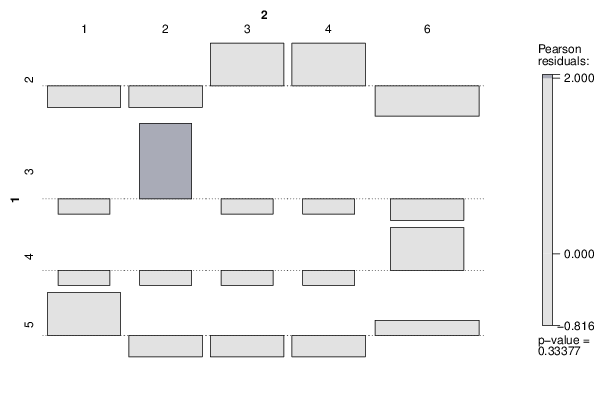
| Statistical Results | |
| Pearson's Chi-squared test with simulated p-value (based on 2000 replicates) | |
| Exact Pearson Chi Square Statistic | 13.5 |
| P value | 0.93 |