Free Statistics

of Irreproducible Research!

Author's title

Author*The author of this computation has been verified*
R Software Modulerwasp_multipleregression.wasp
Title produced by softwareMultiple Regression
Date of computationTue, 18 Dec 2012 11:19:52 -0500
Cite this page as followsStatistical Computations at FreeStatistics.org, Office for Research Development and Education, URL https://freestatistics.org/blog/index.php?v=date/2012/Dec/18/t1355847627ce2ymtlm9ahrfko.htm/, Retrieved Thu, 25 Apr 2024 09:29:47 +0000
Statistical Computations at FreeStatistics.org, Office for Research Development and Education, URL https://freestatistics.org/blog/index.php?pk=201478, Retrieved Thu, 25 Apr 2024 09:29:47 +0000
QR Codes:

Original text written by user:
IsPrivate?No (this computation is public)
User-defined keywords
Estimated Impact92
Family? (F = Feedback message, R = changed R code, M = changed R Module, P = changed Parameters, D = changed Data)
-     [Multiple Regression] [HPC Retail Sales] [2008-03-08 13:40:54] [1c0f2c85e8a48e42648374b3bcceca26]
-  MPD    [Multiple Regression] [] [2012-12-18 16:19:52] [7d61013405aa85534cb0146e7095f1e4] [Current]
Feedback Forum

Post a new message
Dataseries X:
7116
6927
6731
6850
6766
6979
7149
7067
7170
7237
7240
7645
7678
7491
7816
7631
8395
8578
8950
9450
9501
10083
10544
11299
12049
12860
13389
13796
14505
14727
14646
14861
15012
15421
15227
15124
14953
15039
15128
15221
14876
14517
14609
14735
14574
14636
15104
14393
13919
13751
13628
13792
13892
14024
13908
13920
13897
13759
13323
13097
12758
12806
12673
12500
12720
12749
12794
12544
12088
12258


Summary of computational transaction
Raw Inputview raw input (R code)
Raw Outputview raw output of R engine
Computing time8 seconds
R Server'Sir Maurice George Kendall' @ kendall.wessa.net

\begin{tabular}{lllllllll}
\hline
Summary of computational transaction \tabularnewline
Raw Input & view raw input (R code)  \tabularnewline
Raw Output & view raw output of R engine  \tabularnewline
Computing time & 8 seconds \tabularnewline
R Server & 'Sir Maurice George Kendall' @ kendall.wessa.net \tabularnewline
\hline
\end{tabular}
%Source: https://freestatistics.org/blog/index.php?pk=201478&T=0

[TABLE]
[ROW][C]Summary of computational transaction[/C][/ROW]
[ROW][C]Raw Input[/C][C]view raw input (R code) [/C][/ROW]
[ROW][C]Raw Output[/C][C]view raw output of R engine [/C][/ROW]
[ROW][C]Computing time[/C][C]8 seconds[/C][/ROW]
[ROW][C]R Server[/C][C]'Sir Maurice George Kendall' @ kendall.wessa.net[/C][/ROW]
[/TABLE]
Source: https://freestatistics.org/blog/index.php?pk=201478&T=0

Globally Unique Identifier (entire table): ba.freestatistics.org/blog/index.php?pk=201478&T=0

As an alternative you can also use a QR Code:  

The GUIDs for individual cells are displayed in the table below:

Summary of computational transaction
Raw Inputview raw input (R code)
Raw Outputview raw output of R engine
Computing time8 seconds
R Server'Sir Maurice George Kendall' @ kendall.wessa.net


Multiple Linear Regression - Estimated Regression Equation
Nojob[t] = + 8413.82307692307 -358.075427350427M1[t] -399.513675213674M2[t] -425.951923076922M3[t] -463.39017094017M4[t] -344.328418803418M5[t] -382.599999999999M6[t] -410.538247863247M7[t] -431.976495726495M8[t] -596.08141025641M9[t] -512.352991452991M10[t] + 84.2715811965813M11[t] + 108.271581196581t + e[t]

\begin{tabular}{lllllllll}
\hline
Multiple Linear Regression - Estimated Regression Equation \tabularnewline
Nojob[t] =  +  8413.82307692307 -358.075427350427M1[t] -399.513675213674M2[t] -425.951923076922M3[t] -463.39017094017M4[t] -344.328418803418M5[t] -382.599999999999M6[t] -410.538247863247M7[t] -431.976495726495M8[t] -596.08141025641M9[t] -512.352991452991M10[t] +  84.2715811965813M11[t] +  108.271581196581t  + e[t] \tabularnewline
\hline
\end{tabular}
%Source: https://freestatistics.org/blog/index.php?pk=201478&T=1

[TABLE]
[ROW][C]Multiple Linear Regression - Estimated Regression Equation[/C][/ROW]
[ROW][C]Nojob[t] =  +  8413.82307692307 -358.075427350427M1[t] -399.513675213674M2[t] -425.951923076922M3[t] -463.39017094017M4[t] -344.328418803418M5[t] -382.599999999999M6[t] -410.538247863247M7[t] -431.976495726495M8[t] -596.08141025641M9[t] -512.352991452991M10[t] +  84.2715811965813M11[t] +  108.271581196581t  + e[t][/C][/ROW]
[/TABLE]
Source: https://freestatistics.org/blog/index.php?pk=201478&T=1

Globally Unique Identifier (entire table): ba.freestatistics.org/blog/index.php?pk=201478&T=1

As an alternative you can also use a QR Code:  

The GUIDs for individual cells are displayed in the table below:

Multiple Linear Regression - Estimated Regression Equation
Nojob[t] = + 8413.82307692307 -358.075427350427M1[t] -399.513675213674M2[t] -425.951923076922M3[t] -463.39017094017M4[t] -344.328418803418M5[t] -382.599999999999M6[t] -410.538247863247M7[t] -431.976495726495M8[t] -596.08141025641M9[t] -512.352991452991M10[t] + 84.2715811965813M11[t] + 108.271581196581t + e[t]


Multiple Linear Regression - Ordinary Least Squares
VariableParameterS.D.T-STATH0: parameter = 02-tail p-value1-tail p-value
(Intercept)8413.823076923071133.0870247.425600
M1-358.0754273504271384.593506-0.25860.7968650.398432
M2-399.5136752136741383.989686-0.28870.7738830.386941
M3-425.9519230769221383.519866-0.30790.7592990.37965
M4-463.390170940171383.184182-0.3350.7388420.369421
M5-344.3284188034181382.982733-0.2490.8042750.402137
M6-382.5999999999991382.915576-0.27670.7830410.39152
M7-410.5382478632471382.982733-0.29680.767660.38383
M8-431.9764957264951383.184182-0.31230.7559480.377974
M9-596.081410256411383.519866-0.43080.6682070.334103
M10-512.3529914529911383.989686-0.37020.7126060.356303
M1184.27158119658131444.4725090.05830.9536810.476841
t108.27158119658113.6289197.944300

\begin{tabular}{lllllllll}
\hline
Multiple Linear Regression - Ordinary Least Squares \tabularnewline
Variable & Parameter & S.D. & T-STATH0: parameter = 0 & 2-tail p-value & 1-tail p-value \tabularnewline
(Intercept) & 8413.82307692307 & 1133.087024 & 7.4256 & 0 & 0 \tabularnewline
M1 & -358.075427350427 & 1384.593506 & -0.2586 & 0.796865 & 0.398432 \tabularnewline
M2 & -399.513675213674 & 1383.989686 & -0.2887 & 0.773883 & 0.386941 \tabularnewline
M3 & -425.951923076922 & 1383.519866 & -0.3079 & 0.759299 & 0.37965 \tabularnewline
M4 & -463.39017094017 & 1383.184182 & -0.335 & 0.738842 & 0.369421 \tabularnewline
M5 & -344.328418803418 & 1382.982733 & -0.249 & 0.804275 & 0.402137 \tabularnewline
M6 & -382.599999999999 & 1382.915576 & -0.2767 & 0.783041 & 0.39152 \tabularnewline
M7 & -410.538247863247 & 1382.982733 & -0.2968 & 0.76766 & 0.38383 \tabularnewline
M8 & -431.976495726495 & 1383.184182 & -0.3123 & 0.755948 & 0.377974 \tabularnewline
M9 & -596.08141025641 & 1383.519866 & -0.4308 & 0.668207 & 0.334103 \tabularnewline
M10 & -512.352991452991 & 1383.989686 & -0.3702 & 0.712606 & 0.356303 \tabularnewline
M11 & 84.2715811965813 & 1444.472509 & 0.0583 & 0.953681 & 0.476841 \tabularnewline
t & 108.271581196581 & 13.628919 & 7.9443 & 0 & 0 \tabularnewline
\hline
\end{tabular}
%Source: https://freestatistics.org/blog/index.php?pk=201478&T=2

[TABLE]
[ROW][C]Multiple Linear Regression - Ordinary Least Squares[/C][/ROW]
[ROW][C]Variable[/C][C]Parameter[/C][C]S.D.[/C][C]T-STATH0: parameter = 0[/C][C]2-tail p-value[/C][C]1-tail p-value[/C][/ROW]
[ROW][C](Intercept)[/C][C]8413.82307692307[/C][C]1133.087024[/C][C]7.4256[/C][C]0[/C][C]0[/C][/ROW]
[ROW][C]M1[/C][C]-358.075427350427[/C][C]1384.593506[/C][C]-0.2586[/C][C]0.796865[/C][C]0.398432[/C][/ROW]
[ROW][C]M2[/C][C]-399.513675213674[/C][C]1383.989686[/C][C]-0.2887[/C][C]0.773883[/C][C]0.386941[/C][/ROW]
[ROW][C]M3[/C][C]-425.951923076922[/C][C]1383.519866[/C][C]-0.3079[/C][C]0.759299[/C][C]0.37965[/C][/ROW]
[ROW][C]M4[/C][C]-463.39017094017[/C][C]1383.184182[/C][C]-0.335[/C][C]0.738842[/C][C]0.369421[/C][/ROW]
[ROW][C]M5[/C][C]-344.328418803418[/C][C]1382.982733[/C][C]-0.249[/C][C]0.804275[/C][C]0.402137[/C][/ROW]
[ROW][C]M6[/C][C]-382.599999999999[/C][C]1382.915576[/C][C]-0.2767[/C][C]0.783041[/C][C]0.39152[/C][/ROW]
[ROW][C]M7[/C][C]-410.538247863247[/C][C]1382.982733[/C][C]-0.2968[/C][C]0.76766[/C][C]0.38383[/C][/ROW]
[ROW][C]M8[/C][C]-431.976495726495[/C][C]1383.184182[/C][C]-0.3123[/C][C]0.755948[/C][C]0.377974[/C][/ROW]
[ROW][C]M9[/C][C]-596.08141025641[/C][C]1383.519866[/C][C]-0.4308[/C][C]0.668207[/C][C]0.334103[/C][/ROW]
[ROW][C]M10[/C][C]-512.352991452991[/C][C]1383.989686[/C][C]-0.3702[/C][C]0.712606[/C][C]0.356303[/C][/ROW]
[ROW][C]M11[/C][C]84.2715811965813[/C][C]1444.472509[/C][C]0.0583[/C][C]0.953681[/C][C]0.476841[/C][/ROW]
[ROW][C]t[/C][C]108.271581196581[/C][C]13.628919[/C][C]7.9443[/C][C]0[/C][C]0[/C][/ROW]
[/TABLE]
Source: https://freestatistics.org/blog/index.php?pk=201478&T=2

Globally Unique Identifier (entire table): ba.freestatistics.org/blog/index.php?pk=201478&T=2

As an alternative you can also use a QR Code:  

The GUIDs for individual cells are displayed in the table below:

Multiple Linear Regression - Ordinary Least Squares
VariableParameterS.D.T-STATH0: parameter = 02-tail p-value1-tail p-value
(Intercept)8413.823076923071133.0870247.425600
M1-358.0754273504271384.593506-0.25860.7968650.398432
M2-399.5136752136741383.989686-0.28870.7738830.386941
M3-425.9519230769221383.519866-0.30790.7592990.37965
M4-463.390170940171383.184182-0.3350.7388420.369421
M5-344.3284188034181382.982733-0.2490.8042750.402137
M6-382.5999999999991382.915576-0.27670.7830410.39152
M7-410.5382478632471382.982733-0.29680.767660.38383
M8-431.9764957264951383.184182-0.31230.7559480.377974
M9-596.081410256411383.519866-0.43080.6682070.334103
M10-512.3529914529911383.989686-0.37020.7126060.356303
M1184.27158119658131444.4725090.05830.9536810.476841
t108.27158119658113.6289197.944300


Multiple Linear Regression - Regression Statistics
Multiple R0.728127318123559
R-squared0.530169391397807
Adjusted R-squared0.431257684323661
F-TEST (value)5.36002670543723
F-TEST (DF numerator)12
F-TEST (DF denominator)57
p-value5.62955250704711e-06
Multiple Linear Regression - Residual Statistics
Residual Standard Deviation2283.80990988215
Sum Squared Residuals297299899.155128

\begin{tabular}{lllllllll}
\hline
Multiple Linear Regression - Regression Statistics \tabularnewline
Multiple R & 0.728127318123559 \tabularnewline
R-squared & 0.530169391397807 \tabularnewline
Adjusted R-squared & 0.431257684323661 \tabularnewline
F-TEST (value) & 5.36002670543723 \tabularnewline
F-TEST (DF numerator) & 12 \tabularnewline
F-TEST (DF denominator) & 57 \tabularnewline
p-value & 5.62955250704711e-06 \tabularnewline
Multiple Linear Regression - Residual Statistics \tabularnewline
Residual Standard Deviation & 2283.80990988215 \tabularnewline
Sum Squared Residuals & 297299899.155128 \tabularnewline
\hline
\end{tabular}
%Source: https://freestatistics.org/blog/index.php?pk=201478&T=3

[TABLE]
[ROW][C]Multiple Linear Regression - Regression Statistics[/C][/ROW]
[ROW][C]Multiple R[/C][C]0.728127318123559[/C][/ROW]
[ROW][C]R-squared[/C][C]0.530169391397807[/C][/ROW]
[ROW][C]Adjusted R-squared[/C][C]0.431257684323661[/C][/ROW]
[ROW][C]F-TEST (value)[/C][C]5.36002670543723[/C][/ROW]
[ROW][C]F-TEST (DF numerator)[/C][C]12[/C][/ROW]
[ROW][C]F-TEST (DF denominator)[/C][C]57[/C][/ROW]
[ROW][C]p-value[/C][C]5.62955250704711e-06[/C][/ROW]
[ROW][C]Multiple Linear Regression - Residual Statistics[/C][/ROW]
[ROW][C]Residual Standard Deviation[/C][C]2283.80990988215[/C][/ROW]
[ROW][C]Sum Squared Residuals[/C][C]297299899.155128[/C][/ROW]
[/TABLE]
Source: https://freestatistics.org/blog/index.php?pk=201478&T=3

Globally Unique Identifier (entire table): ba.freestatistics.org/blog/index.php?pk=201478&T=3

As an alternative you can also use a QR Code:  

The GUIDs for individual cells are displayed in the table below:

Multiple Linear Regression - Regression Statistics
Multiple R0.728127318123559
R-squared0.530169391397807
Adjusted R-squared0.431257684323661
F-TEST (value)5.36002670543723
F-TEST (DF numerator)12
F-TEST (DF denominator)57
p-value5.62955250704711e-06
Multiple Linear Regression - Residual Statistics
Residual Standard Deviation2283.80990988215
Sum Squared Residuals297299899.155128


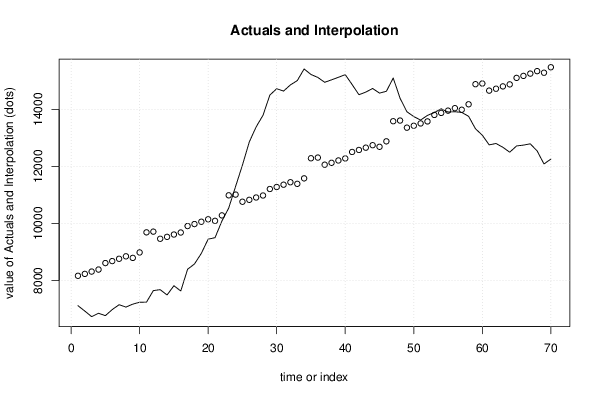
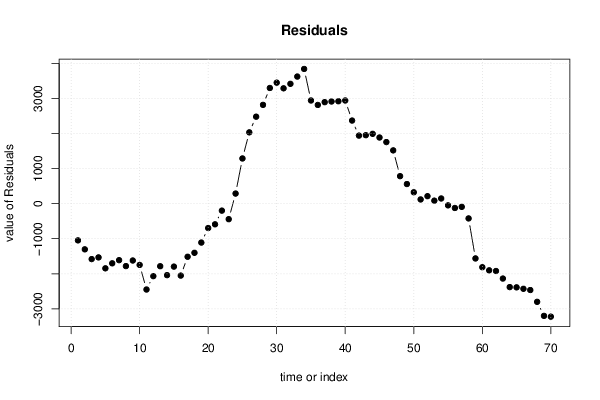
Multiple Linear Regression - Actuals, Interpolation, and Residuals
Time or IndexActualsInterpolationForecastResidualsPrediction Error
171168164.01923076923-1048.01923076923
269278230.85256410256-1303.85256410256
367318312.6858974359-1581.6858974359
468508383.51923076923-1533.51923076923
567668610.85256410256-1844.85256410256
669798680.85256410256-1701.85256410256
771498761.1858974359-1612.1858974359
870678848.01923076923-1781.01923076923
971708792.1858974359-1622.1858974359
1072378984.1858974359-1747.1858974359
1172409689.08205128205-2449.08205128205
1276459713.08205128205-2068.08205128205
1376789463.27820512821-1785.27820512821
1474919530.11153846154-2039.11153846154
1578169611.94487179487-1795.94487179487
1676319682.7782051282-2051.77820512821
1783959910.11153846154-1515.11153846154
1885789980.11153846154-1402.11153846154
19895010060.4448717949-1110.44487179487
20945010147.2782051282-697.278205128204
21950110091.4448717949-590.444871794871
221008310283.4448717949-200.444871794871
231054410988.341025641-444.341025641026
241129911012.341025641286.658974358974
251204910762.53717948721286.46282051282
261286010829.37051282052030.62948717949
271338910911.20384615382477.79615384615
281379610982.03717948722813.96282051282
291450511209.37051282053295.62948717949
301472711279.37051282053447.62948717949
311464611359.70384615383286.29615384615
321486111446.53717948723414.46282051282
331501211390.70384615383621.29615384615
341542111582.70384615383838.29615384615
351522712287.62939.4
361512412311.62812.4
371495312061.79615384622891.20384615385
381503912128.62948717952910.37051282051
391512812210.46282051282917.53717948718
401522112281.29615384622939.70384615385
411487612508.62948717952367.37051282051
421451712578.62948717951938.37051282051
431460912658.96282051281950.03717948718
441473512745.79615384621989.20384615385
451457412689.96282051281884.03717948718
461463612881.96282051281754.03717948718
471510413586.8589743591517.14102564103
481439313610.858974359782.141025641026
491391913361.0551282051557.944871794872
501375113427.8884615385323.111538461538
511362813509.7217948718118.278205128205
521379213580.5551282051211.444871794872
531389213807.888461538584.1115384615384
541402413877.8884615385146.111538461538
551390813958.2217948718-50.2217948717951
561392014045.0551282051-125.055128205127
571389713989.2217948718-92.2217948717952
581375914181.2217948718-422.221794871795
591332314886.1179487179-1563.11794871795
601309714910.1179487179-1813.11794871795
611275814660.3141025641-1902.3141025641
621280614727.1474358974-1921.14743589744
631267314808.9807692308-2135.98076923077
641250014879.8141025641-2379.8141025641
651272015107.1474358974-2387.14743589744
661274915177.1474358974-2428.14743589744
671279415257.4807692308-2463.48076923077
681254415344.3141025641-2800.3141025641
691208815288.4807692308-3200.48076923077
701225815480.4807692308-3222.48076923077

\begin{tabular}{lllllllll}
\hline
Multiple Linear Regression - Actuals, Interpolation, and Residuals \tabularnewline
Time or Index & Actuals & InterpolationForecast & ResidualsPrediction Error \tabularnewline
1 & 7116 & 8164.01923076923 & -1048.01923076923 \tabularnewline
2 & 6927 & 8230.85256410256 & -1303.85256410256 \tabularnewline
3 & 6731 & 8312.6858974359 & -1581.6858974359 \tabularnewline
4 & 6850 & 8383.51923076923 & -1533.51923076923 \tabularnewline
5 & 6766 & 8610.85256410256 & -1844.85256410256 \tabularnewline
6 & 6979 & 8680.85256410256 & -1701.85256410256 \tabularnewline
7 & 7149 & 8761.1858974359 & -1612.1858974359 \tabularnewline
8 & 7067 & 8848.01923076923 & -1781.01923076923 \tabularnewline
9 & 7170 & 8792.1858974359 & -1622.1858974359 \tabularnewline
10 & 7237 & 8984.1858974359 & -1747.1858974359 \tabularnewline
11 & 7240 & 9689.08205128205 & -2449.08205128205 \tabularnewline
12 & 7645 & 9713.08205128205 & -2068.08205128205 \tabularnewline
13 & 7678 & 9463.27820512821 & -1785.27820512821 \tabularnewline
14 & 7491 & 9530.11153846154 & -2039.11153846154 \tabularnewline
15 & 7816 & 9611.94487179487 & -1795.94487179487 \tabularnewline
16 & 7631 & 9682.7782051282 & -2051.77820512821 \tabularnewline
17 & 8395 & 9910.11153846154 & -1515.11153846154 \tabularnewline
18 & 8578 & 9980.11153846154 & -1402.11153846154 \tabularnewline
19 & 8950 & 10060.4448717949 & -1110.44487179487 \tabularnewline
20 & 9450 & 10147.2782051282 & -697.278205128204 \tabularnewline
21 & 9501 & 10091.4448717949 & -590.444871794871 \tabularnewline
22 & 10083 & 10283.4448717949 & -200.444871794871 \tabularnewline
23 & 10544 & 10988.341025641 & -444.341025641026 \tabularnewline
24 & 11299 & 11012.341025641 & 286.658974358974 \tabularnewline
25 & 12049 & 10762.5371794872 & 1286.46282051282 \tabularnewline
26 & 12860 & 10829.3705128205 & 2030.62948717949 \tabularnewline
27 & 13389 & 10911.2038461538 & 2477.79615384615 \tabularnewline
28 & 13796 & 10982.0371794872 & 2813.96282051282 \tabularnewline
29 & 14505 & 11209.3705128205 & 3295.62948717949 \tabularnewline
30 & 14727 & 11279.3705128205 & 3447.62948717949 \tabularnewline
31 & 14646 & 11359.7038461538 & 3286.29615384615 \tabularnewline
32 & 14861 & 11446.5371794872 & 3414.46282051282 \tabularnewline
33 & 15012 & 11390.7038461538 & 3621.29615384615 \tabularnewline
34 & 15421 & 11582.7038461538 & 3838.29615384615 \tabularnewline
35 & 15227 & 12287.6 & 2939.4 \tabularnewline
36 & 15124 & 12311.6 & 2812.4 \tabularnewline
37 & 14953 & 12061.7961538462 & 2891.20384615385 \tabularnewline
38 & 15039 & 12128.6294871795 & 2910.37051282051 \tabularnewline
39 & 15128 & 12210.4628205128 & 2917.53717948718 \tabularnewline
40 & 15221 & 12281.2961538462 & 2939.70384615385 \tabularnewline
41 & 14876 & 12508.6294871795 & 2367.37051282051 \tabularnewline
42 & 14517 & 12578.6294871795 & 1938.37051282051 \tabularnewline
43 & 14609 & 12658.9628205128 & 1950.03717948718 \tabularnewline
44 & 14735 & 12745.7961538462 & 1989.20384615385 \tabularnewline
45 & 14574 & 12689.9628205128 & 1884.03717948718 \tabularnewline
46 & 14636 & 12881.9628205128 & 1754.03717948718 \tabularnewline
47 & 15104 & 13586.858974359 & 1517.14102564103 \tabularnewline
48 & 14393 & 13610.858974359 & 782.141025641026 \tabularnewline
49 & 13919 & 13361.0551282051 & 557.944871794872 \tabularnewline
50 & 13751 & 13427.8884615385 & 323.111538461538 \tabularnewline
51 & 13628 & 13509.7217948718 & 118.278205128205 \tabularnewline
52 & 13792 & 13580.5551282051 & 211.444871794872 \tabularnewline
53 & 13892 & 13807.8884615385 & 84.1115384615384 \tabularnewline
54 & 14024 & 13877.8884615385 & 146.111538461538 \tabularnewline
55 & 13908 & 13958.2217948718 & -50.2217948717951 \tabularnewline
56 & 13920 & 14045.0551282051 & -125.055128205127 \tabularnewline
57 & 13897 & 13989.2217948718 & -92.2217948717952 \tabularnewline
58 & 13759 & 14181.2217948718 & -422.221794871795 \tabularnewline
59 & 13323 & 14886.1179487179 & -1563.11794871795 \tabularnewline
60 & 13097 & 14910.1179487179 & -1813.11794871795 \tabularnewline
61 & 12758 & 14660.3141025641 & -1902.3141025641 \tabularnewline
62 & 12806 & 14727.1474358974 & -1921.14743589744 \tabularnewline
63 & 12673 & 14808.9807692308 & -2135.98076923077 \tabularnewline
64 & 12500 & 14879.8141025641 & -2379.8141025641 \tabularnewline
65 & 12720 & 15107.1474358974 & -2387.14743589744 \tabularnewline
66 & 12749 & 15177.1474358974 & -2428.14743589744 \tabularnewline
67 & 12794 & 15257.4807692308 & -2463.48076923077 \tabularnewline
68 & 12544 & 15344.3141025641 & -2800.3141025641 \tabularnewline
69 & 12088 & 15288.4807692308 & -3200.48076923077 \tabularnewline
70 & 12258 & 15480.4807692308 & -3222.48076923077 \tabularnewline
\hline
\end{tabular}
%Source: https://freestatistics.org/blog/index.php?pk=201478&T=4

[TABLE]
[ROW][C]Multiple Linear Regression - Actuals, Interpolation, and Residuals[/C][/ROW]
[ROW][C]Time or Index[/C][C]Actuals[/C][C]InterpolationForecast[/C][C]ResidualsPrediction Error[/C][/ROW]
[ROW][C]1[/C][C]7116[/C][C]8164.01923076923[/C][C]-1048.01923076923[/C][/ROW]
[ROW][C]2[/C][C]6927[/C][C]8230.85256410256[/C][C]-1303.85256410256[/C][/ROW]
[ROW][C]3[/C][C]6731[/C][C]8312.6858974359[/C][C]-1581.6858974359[/C][/ROW]
[ROW][C]4[/C][C]6850[/C][C]8383.51923076923[/C][C]-1533.51923076923[/C][/ROW]
[ROW][C]5[/C][C]6766[/C][C]8610.85256410256[/C][C]-1844.85256410256[/C][/ROW]
[ROW][C]6[/C][C]6979[/C][C]8680.85256410256[/C][C]-1701.85256410256[/C][/ROW]
[ROW][C]7[/C][C]7149[/C][C]8761.1858974359[/C][C]-1612.1858974359[/C][/ROW]
[ROW][C]8[/C][C]7067[/C][C]8848.01923076923[/C][C]-1781.01923076923[/C][/ROW]
[ROW][C]9[/C][C]7170[/C][C]8792.1858974359[/C][C]-1622.1858974359[/C][/ROW]
[ROW][C]10[/C][C]7237[/C][C]8984.1858974359[/C][C]-1747.1858974359[/C][/ROW]
[ROW][C]11[/C][C]7240[/C][C]9689.08205128205[/C][C]-2449.08205128205[/C][/ROW]
[ROW][C]12[/C][C]7645[/C][C]9713.08205128205[/C][C]-2068.08205128205[/C][/ROW]
[ROW][C]13[/C][C]7678[/C][C]9463.27820512821[/C][C]-1785.27820512821[/C][/ROW]
[ROW][C]14[/C][C]7491[/C][C]9530.11153846154[/C][C]-2039.11153846154[/C][/ROW]
[ROW][C]15[/C][C]7816[/C][C]9611.94487179487[/C][C]-1795.94487179487[/C][/ROW]
[ROW][C]16[/C][C]7631[/C][C]9682.7782051282[/C][C]-2051.77820512821[/C][/ROW]
[ROW][C]17[/C][C]8395[/C][C]9910.11153846154[/C][C]-1515.11153846154[/C][/ROW]
[ROW][C]18[/C][C]8578[/C][C]9980.11153846154[/C][C]-1402.11153846154[/C][/ROW]
[ROW][C]19[/C][C]8950[/C][C]10060.4448717949[/C][C]-1110.44487179487[/C][/ROW]
[ROW][C]20[/C][C]9450[/C][C]10147.2782051282[/C][C]-697.278205128204[/C][/ROW]
[ROW][C]21[/C][C]9501[/C][C]10091.4448717949[/C][C]-590.444871794871[/C][/ROW]
[ROW][C]22[/C][C]10083[/C][C]10283.4448717949[/C][C]-200.444871794871[/C][/ROW]
[ROW][C]23[/C][C]10544[/C][C]10988.341025641[/C][C]-444.341025641026[/C][/ROW]
[ROW][C]24[/C][C]11299[/C][C]11012.341025641[/C][C]286.658974358974[/C][/ROW]
[ROW][C]25[/C][C]12049[/C][C]10762.5371794872[/C][C]1286.46282051282[/C][/ROW]
[ROW][C]26[/C][C]12860[/C][C]10829.3705128205[/C][C]2030.62948717949[/C][/ROW]
[ROW][C]27[/C][C]13389[/C][C]10911.2038461538[/C][C]2477.79615384615[/C][/ROW]
[ROW][C]28[/C][C]13796[/C][C]10982.0371794872[/C][C]2813.96282051282[/C][/ROW]
[ROW][C]29[/C][C]14505[/C][C]11209.3705128205[/C][C]3295.62948717949[/C][/ROW]
[ROW][C]30[/C][C]14727[/C][C]11279.3705128205[/C][C]3447.62948717949[/C][/ROW]
[ROW][C]31[/C][C]14646[/C][C]11359.7038461538[/C][C]3286.29615384615[/C][/ROW]
[ROW][C]32[/C][C]14861[/C][C]11446.5371794872[/C][C]3414.46282051282[/C][/ROW]
[ROW][C]33[/C][C]15012[/C][C]11390.7038461538[/C][C]3621.29615384615[/C][/ROW]
[ROW][C]34[/C][C]15421[/C][C]11582.7038461538[/C][C]3838.29615384615[/C][/ROW]
[ROW][C]35[/C][C]15227[/C][C]12287.6[/C][C]2939.4[/C][/ROW]
[ROW][C]36[/C][C]15124[/C][C]12311.6[/C][C]2812.4[/C][/ROW]
[ROW][C]37[/C][C]14953[/C][C]12061.7961538462[/C][C]2891.20384615385[/C][/ROW]
[ROW][C]38[/C][C]15039[/C][C]12128.6294871795[/C][C]2910.37051282051[/C][/ROW]
[ROW][C]39[/C][C]15128[/C][C]12210.4628205128[/C][C]2917.53717948718[/C][/ROW]
[ROW][C]40[/C][C]15221[/C][C]12281.2961538462[/C][C]2939.70384615385[/C][/ROW]
[ROW][C]41[/C][C]14876[/C][C]12508.6294871795[/C][C]2367.37051282051[/C][/ROW]
[ROW][C]42[/C][C]14517[/C][C]12578.6294871795[/C][C]1938.37051282051[/C][/ROW]
[ROW][C]43[/C][C]14609[/C][C]12658.9628205128[/C][C]1950.03717948718[/C][/ROW]
[ROW][C]44[/C][C]14735[/C][C]12745.7961538462[/C][C]1989.20384615385[/C][/ROW]
[ROW][C]45[/C][C]14574[/C][C]12689.9628205128[/C][C]1884.03717948718[/C][/ROW]
[ROW][C]46[/C][C]14636[/C][C]12881.9628205128[/C][C]1754.03717948718[/C][/ROW]
[ROW][C]47[/C][C]15104[/C][C]13586.858974359[/C][C]1517.14102564103[/C][/ROW]
[ROW][C]48[/C][C]14393[/C][C]13610.858974359[/C][C]782.141025641026[/C][/ROW]
[ROW][C]49[/C][C]13919[/C][C]13361.0551282051[/C][C]557.944871794872[/C][/ROW]
[ROW][C]50[/C][C]13751[/C][C]13427.8884615385[/C][C]323.111538461538[/C][/ROW]
[ROW][C]51[/C][C]13628[/C][C]13509.7217948718[/C][C]118.278205128205[/C][/ROW]
[ROW][C]52[/C][C]13792[/C][C]13580.5551282051[/C][C]211.444871794872[/C][/ROW]
[ROW][C]53[/C][C]13892[/C][C]13807.8884615385[/C][C]84.1115384615384[/C][/ROW]
[ROW][C]54[/C][C]14024[/C][C]13877.8884615385[/C][C]146.111538461538[/C][/ROW]
[ROW][C]55[/C][C]13908[/C][C]13958.2217948718[/C][C]-50.2217948717951[/C][/ROW]
[ROW][C]56[/C][C]13920[/C][C]14045.0551282051[/C][C]-125.055128205127[/C][/ROW]
[ROW][C]57[/C][C]13897[/C][C]13989.2217948718[/C][C]-92.2217948717952[/C][/ROW]
[ROW][C]58[/C][C]13759[/C][C]14181.2217948718[/C][C]-422.221794871795[/C][/ROW]
[ROW][C]59[/C][C]13323[/C][C]14886.1179487179[/C][C]-1563.11794871795[/C][/ROW]
[ROW][C]60[/C][C]13097[/C][C]14910.1179487179[/C][C]-1813.11794871795[/C][/ROW]
[ROW][C]61[/C][C]12758[/C][C]14660.3141025641[/C][C]-1902.3141025641[/C][/ROW]
[ROW][C]62[/C][C]12806[/C][C]14727.1474358974[/C][C]-1921.14743589744[/C][/ROW]
[ROW][C]63[/C][C]12673[/C][C]14808.9807692308[/C][C]-2135.98076923077[/C][/ROW]
[ROW][C]64[/C][C]12500[/C][C]14879.8141025641[/C][C]-2379.8141025641[/C][/ROW]
[ROW][C]65[/C][C]12720[/C][C]15107.1474358974[/C][C]-2387.14743589744[/C][/ROW]
[ROW][C]66[/C][C]12749[/C][C]15177.1474358974[/C][C]-2428.14743589744[/C][/ROW]
[ROW][C]67[/C][C]12794[/C][C]15257.4807692308[/C][C]-2463.48076923077[/C][/ROW]
[ROW][C]68[/C][C]12544[/C][C]15344.3141025641[/C][C]-2800.3141025641[/C][/ROW]
[ROW][C]69[/C][C]12088[/C][C]15288.4807692308[/C][C]-3200.48076923077[/C][/ROW]
[ROW][C]70[/C][C]12258[/C][C]15480.4807692308[/C][C]-3222.48076923077[/C][/ROW]
[/TABLE]
Source: https://freestatistics.org/blog/index.php?pk=201478&T=4

Globally Unique Identifier (entire table): ba.freestatistics.org/blog/index.php?pk=201478&T=4

As an alternative you can also use a QR Code:  

The GUIDs for individual cells are displayed in the table below:

Multiple Linear Regression - Actuals, Interpolation, and Residuals
Time or IndexActualsInterpolationForecastResidualsPrediction Error
171168164.01923076923-1048.01923076923
269278230.85256410256-1303.85256410256
367318312.6858974359-1581.6858974359
468508383.51923076923-1533.51923076923
567668610.85256410256-1844.85256410256
669798680.85256410256-1701.85256410256
771498761.1858974359-1612.1858974359
870678848.01923076923-1781.01923076923
971708792.1858974359-1622.1858974359
1072378984.1858974359-1747.1858974359
1172409689.08205128205-2449.08205128205
1276459713.08205128205-2068.08205128205
1376789463.27820512821-1785.27820512821
1474919530.11153846154-2039.11153846154
1578169611.94487179487-1795.94487179487
1676319682.7782051282-2051.77820512821
1783959910.11153846154-1515.11153846154
1885789980.11153846154-1402.11153846154
19895010060.4448717949-1110.44487179487
20945010147.2782051282-697.278205128204
21950110091.4448717949-590.444871794871
221008310283.4448717949-200.444871794871
231054410988.341025641-444.341025641026
241129911012.341025641286.658974358974
251204910762.53717948721286.46282051282
261286010829.37051282052030.62948717949
271338910911.20384615382477.79615384615
281379610982.03717948722813.96282051282
291450511209.37051282053295.62948717949
301472711279.37051282053447.62948717949
311464611359.70384615383286.29615384615
321486111446.53717948723414.46282051282
331501211390.70384615383621.29615384615
341542111582.70384615383838.29615384615
351522712287.62939.4
361512412311.62812.4
371495312061.79615384622891.20384615385
381503912128.62948717952910.37051282051
391512812210.46282051282917.53717948718
401522112281.29615384622939.70384615385
411487612508.62948717952367.37051282051
421451712578.62948717951938.37051282051
431460912658.96282051281950.03717948718
441473512745.79615384621989.20384615385
451457412689.96282051281884.03717948718
461463612881.96282051281754.03717948718
471510413586.8589743591517.14102564103
481439313610.858974359782.141025641026
491391913361.0551282051557.944871794872
501375113427.8884615385323.111538461538
511362813509.7217948718118.278205128205
521379213580.5551282051211.444871794872
531389213807.888461538584.1115384615384
541402413877.8884615385146.111538461538
551390813958.2217948718-50.2217948717951
561392014045.0551282051-125.055128205127
571389713989.2217948718-92.2217948717952
581375914181.2217948718-422.221794871795
591332314886.1179487179-1563.11794871795
601309714910.1179487179-1813.11794871795
611275814660.3141025641-1902.3141025641
621280614727.1474358974-1921.14743589744
631267314808.9807692308-2135.98076923077
641250014879.8141025641-2379.8141025641
651272015107.1474358974-2387.14743589744
661274915177.1474358974-2428.14743589744
671279415257.4807692308-2463.48076923077
681254415344.3141025641-2800.3141025641
691208815288.4807692308-3200.48076923077
701225815480.4807692308-3222.48076923077


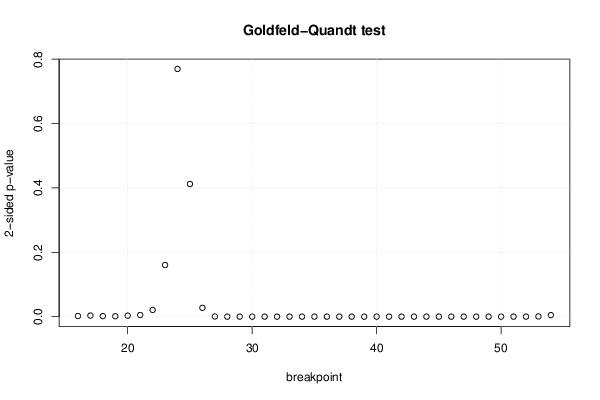
Goldfeld-Quandt test for Heteroskedasticity
p-valuesAlternative Hypothesis
breakpoint indexgreater2-sidedless
160.0009860865970112670.001972173194022530.999013913402989
170.001662306595167590.003324613190335190.998337693404832
180.0008547022876158890.001709404575231780.999145297712384
190.000630984262079140.001261968524158280.999369015737921
200.001540141223445650.003080282446891290.998459858776554
210.002551320151969120.005102640303938240.997448679848031
220.01048797587460780.02097595174921560.989512024125392
230.08024299278665520.160485985573310.919757007213345
240.3848998090382380.7697996180764750.615100190961762
250.7938753967535880.4122492064928240.206124603246412
260.9862801116732420.02743977665351510.0137198883267576
270.9996802334609930.0006395330780140470.000319766539007024
280.9999973156827855.36863442996753e-062.68431721498377e-06
290.9999998933290962.133418079974e-071.066709039987e-07
300.9999999873204542.53590923738668e-081.26795461869334e-08
310.999999999224431.55114072411773e-097.75570362058866e-10
320.9999999999309881.38023107847067e-106.90115539235336e-11
330.9999999999716485.67039579400169e-112.83519789700085e-11
340.999999999945491.09020768479309e-105.45103842396545e-11
350.9999999999732455.3510827601246e-112.6755413800623e-11
360.9999999999191061.61788480891111e-108.08942404455555e-11
370.9999999996921666.15668027082943e-103.07834013541472e-10
380.9999999987515332.49693425327649e-091.24846712663825e-09
390.999999996580656.8387005447353e-093.41935027236765e-09
400.9999999938590041.22819921069175e-086.14099605345875e-09
410.9999999809297193.81405621054749e-081.90702810527374e-08
420.999999990648271.8703459334527e-089.35172966726348e-09
430.9999999937868531.24262943618448e-086.21314718092242e-09
440.9999999875408432.49183140561973e-081.24591570280987e-08
450.9999999710670575.78658852125607e-082.89329426062804e-08
460.9999999356041421.28791716608527e-076.43958583042637e-08
470.999999931931631.36136739610303e-076.80683698051514e-08
480.9999996490314157.01937170439255e-073.50968585219627e-07
490.9999985748070462.85038590741593e-061.42519295370796e-06
500.9999967093152546.58136949112487e-063.29068474556244e-06
510.9999932393472311.3521305536901e-056.76065276845049e-06
520.9999479952973980.0001040094052050055.20047026025025e-05
530.9996922215168040.0006155569663918480.000307778483195924
540.9976334477267920.004733104546415680.00236655227320784

\begin{tabular}{lllllllll}
\hline
Goldfeld-Quandt test for Heteroskedasticity \tabularnewline
p-values & Alternative Hypothesis \tabularnewline
breakpoint index & greater & 2-sided & less \tabularnewline
16 & 0.000986086597011267 & 0.00197217319402253 & 0.999013913402989 \tabularnewline
17 & 0.00166230659516759 & 0.00332461319033519 & 0.998337693404832 \tabularnewline
18 & 0.000854702287615889 & 0.00170940457523178 & 0.999145297712384 \tabularnewline
19 & 0.00063098426207914 & 0.00126196852415828 & 0.999369015737921 \tabularnewline
20 & 0.00154014122344565 & 0.00308028244689129 & 0.998459858776554 \tabularnewline
21 & 0.00255132015196912 & 0.00510264030393824 & 0.997448679848031 \tabularnewline
22 & 0.0104879758746078 & 0.0209759517492156 & 0.989512024125392 \tabularnewline
23 & 0.0802429927866552 & 0.16048598557331 & 0.919757007213345 \tabularnewline
24 & 0.384899809038238 & 0.769799618076475 & 0.615100190961762 \tabularnewline
25 & 0.793875396753588 & 0.412249206492824 & 0.206124603246412 \tabularnewline
26 & 0.986280111673242 & 0.0274397766535151 & 0.0137198883267576 \tabularnewline
27 & 0.999680233460993 & 0.000639533078014047 & 0.000319766539007024 \tabularnewline
28 & 0.999997315682785 & 5.36863442996753e-06 & 2.68431721498377e-06 \tabularnewline
29 & 0.999999893329096 & 2.133418079974e-07 & 1.066709039987e-07 \tabularnewline
30 & 0.999999987320454 & 2.53590923738668e-08 & 1.26795461869334e-08 \tabularnewline
31 & 0.99999999922443 & 1.55114072411773e-09 & 7.75570362058866e-10 \tabularnewline
32 & 0.999999999930988 & 1.38023107847067e-10 & 6.90115539235336e-11 \tabularnewline
33 & 0.999999999971648 & 5.67039579400169e-11 & 2.83519789700085e-11 \tabularnewline
34 & 0.99999999994549 & 1.09020768479309e-10 & 5.45103842396545e-11 \tabularnewline
35 & 0.999999999973245 & 5.3510827601246e-11 & 2.6755413800623e-11 \tabularnewline
36 & 0.999999999919106 & 1.61788480891111e-10 & 8.08942404455555e-11 \tabularnewline
37 & 0.999999999692166 & 6.15668027082943e-10 & 3.07834013541472e-10 \tabularnewline
38 & 0.999999998751533 & 2.49693425327649e-09 & 1.24846712663825e-09 \tabularnewline
39 & 0.99999999658065 & 6.8387005447353e-09 & 3.41935027236765e-09 \tabularnewline
40 & 0.999999993859004 & 1.22819921069175e-08 & 6.14099605345875e-09 \tabularnewline
41 & 0.999999980929719 & 3.81405621054749e-08 & 1.90702810527374e-08 \tabularnewline
42 & 0.99999999064827 & 1.8703459334527e-08 & 9.35172966726348e-09 \tabularnewline
43 & 0.999999993786853 & 1.24262943618448e-08 & 6.21314718092242e-09 \tabularnewline
44 & 0.999999987540843 & 2.49183140561973e-08 & 1.24591570280987e-08 \tabularnewline
45 & 0.999999971067057 & 5.78658852125607e-08 & 2.89329426062804e-08 \tabularnewline
46 & 0.999999935604142 & 1.28791716608527e-07 & 6.43958583042637e-08 \tabularnewline
47 & 0.99999993193163 & 1.36136739610303e-07 & 6.80683698051514e-08 \tabularnewline
48 & 0.999999649031415 & 7.01937170439255e-07 & 3.50968585219627e-07 \tabularnewline
49 & 0.999998574807046 & 2.85038590741593e-06 & 1.42519295370796e-06 \tabularnewline
50 & 0.999996709315254 & 6.58136949112487e-06 & 3.29068474556244e-06 \tabularnewline
51 & 0.999993239347231 & 1.3521305536901e-05 & 6.76065276845049e-06 \tabularnewline
52 & 0.999947995297398 & 0.000104009405205005 & 5.20047026025025e-05 \tabularnewline
53 & 0.999692221516804 & 0.000615556966391848 & 0.000307778483195924 \tabularnewline
54 & 0.997633447726792 & 0.00473310454641568 & 0.00236655227320784 \tabularnewline
\hline
\end{tabular}
%Source: https://freestatistics.org/blog/index.php?pk=201478&T=5

[TABLE]
[ROW][C]Goldfeld-Quandt test for Heteroskedasticity[/C][/ROW]
[ROW][C]p-values[/C][C]Alternative Hypothesis[/C][/ROW]
[ROW][C]breakpoint index[/C][C]greater[/C][C]2-sided[/C][C]less[/C][/ROW]
[ROW][C]16[/C][C]0.000986086597011267[/C][C]0.00197217319402253[/C][C]0.999013913402989[/C][/ROW]
[ROW][C]17[/C][C]0.00166230659516759[/C][C]0.00332461319033519[/C][C]0.998337693404832[/C][/ROW]
[ROW][C]18[/C][C]0.000854702287615889[/C][C]0.00170940457523178[/C][C]0.999145297712384[/C][/ROW]
[ROW][C]19[/C][C]0.00063098426207914[/C][C]0.00126196852415828[/C][C]0.999369015737921[/C][/ROW]
[ROW][C]20[/C][C]0.00154014122344565[/C][C]0.00308028244689129[/C][C]0.998459858776554[/C][/ROW]
[ROW][C]21[/C][C]0.00255132015196912[/C][C]0.00510264030393824[/C][C]0.997448679848031[/C][/ROW]
[ROW][C]22[/C][C]0.0104879758746078[/C][C]0.0209759517492156[/C][C]0.989512024125392[/C][/ROW]
[ROW][C]23[/C][C]0.0802429927866552[/C][C]0.16048598557331[/C][C]0.919757007213345[/C][/ROW]
[ROW][C]24[/C][C]0.384899809038238[/C][C]0.769799618076475[/C][C]0.615100190961762[/C][/ROW]
[ROW][C]25[/C][C]0.793875396753588[/C][C]0.412249206492824[/C][C]0.206124603246412[/C][/ROW]
[ROW][C]26[/C][C]0.986280111673242[/C][C]0.0274397766535151[/C][C]0.0137198883267576[/C][/ROW]
[ROW][C]27[/C][C]0.999680233460993[/C][C]0.000639533078014047[/C][C]0.000319766539007024[/C][/ROW]
[ROW][C]28[/C][C]0.999997315682785[/C][C]5.36863442996753e-06[/C][C]2.68431721498377e-06[/C][/ROW]
[ROW][C]29[/C][C]0.999999893329096[/C][C]2.133418079974e-07[/C][C]1.066709039987e-07[/C][/ROW]
[ROW][C]30[/C][C]0.999999987320454[/C][C]2.53590923738668e-08[/C][C]1.26795461869334e-08[/C][/ROW]
[ROW][C]31[/C][C]0.99999999922443[/C][C]1.55114072411773e-09[/C][C]7.75570362058866e-10[/C][/ROW]
[ROW][C]32[/C][C]0.999999999930988[/C][C]1.38023107847067e-10[/C][C]6.90115539235336e-11[/C][/ROW]
[ROW][C]33[/C][C]0.999999999971648[/C][C]5.67039579400169e-11[/C][C]2.83519789700085e-11[/C][/ROW]
[ROW][C]34[/C][C]0.99999999994549[/C][C]1.09020768479309e-10[/C][C]5.45103842396545e-11[/C][/ROW]
[ROW][C]35[/C][C]0.999999999973245[/C][C]5.3510827601246e-11[/C][C]2.6755413800623e-11[/C][/ROW]
[ROW][C]36[/C][C]0.999999999919106[/C][C]1.61788480891111e-10[/C][C]8.08942404455555e-11[/C][/ROW]
[ROW][C]37[/C][C]0.999999999692166[/C][C]6.15668027082943e-10[/C][C]3.07834013541472e-10[/C][/ROW]
[ROW][C]38[/C][C]0.999999998751533[/C][C]2.49693425327649e-09[/C][C]1.24846712663825e-09[/C][/ROW]
[ROW][C]39[/C][C]0.99999999658065[/C][C]6.8387005447353e-09[/C][C]3.41935027236765e-09[/C][/ROW]
[ROW][C]40[/C][C]0.999999993859004[/C][C]1.22819921069175e-08[/C][C]6.14099605345875e-09[/C][/ROW]
[ROW][C]41[/C][C]0.999999980929719[/C][C]3.81405621054749e-08[/C][C]1.90702810527374e-08[/C][/ROW]
[ROW][C]42[/C][C]0.99999999064827[/C][C]1.8703459334527e-08[/C][C]9.35172966726348e-09[/C][/ROW]
[ROW][C]43[/C][C]0.999999993786853[/C][C]1.24262943618448e-08[/C][C]6.21314718092242e-09[/C][/ROW]
[ROW][C]44[/C][C]0.999999987540843[/C][C]2.49183140561973e-08[/C][C]1.24591570280987e-08[/C][/ROW]
[ROW][C]45[/C][C]0.999999971067057[/C][C]5.78658852125607e-08[/C][C]2.89329426062804e-08[/C][/ROW]
[ROW][C]46[/C][C]0.999999935604142[/C][C]1.28791716608527e-07[/C][C]6.43958583042637e-08[/C][/ROW]
[ROW][C]47[/C][C]0.99999993193163[/C][C]1.36136739610303e-07[/C][C]6.80683698051514e-08[/C][/ROW]
[ROW][C]48[/C][C]0.999999649031415[/C][C]7.01937170439255e-07[/C][C]3.50968585219627e-07[/C][/ROW]
[ROW][C]49[/C][C]0.999998574807046[/C][C]2.85038590741593e-06[/C][C]1.42519295370796e-06[/C][/ROW]
[ROW][C]50[/C][C]0.999996709315254[/C][C]6.58136949112487e-06[/C][C]3.29068474556244e-06[/C][/ROW]
[ROW][C]51[/C][C]0.999993239347231[/C][C]1.3521305536901e-05[/C][C]6.76065276845049e-06[/C][/ROW]
[ROW][C]52[/C][C]0.999947995297398[/C][C]0.000104009405205005[/C][C]5.20047026025025e-05[/C][/ROW]
[ROW][C]53[/C][C]0.999692221516804[/C][C]0.000615556966391848[/C][C]0.000307778483195924[/C][/ROW]
[ROW][C]54[/C][C]0.997633447726792[/C][C]0.00473310454641568[/C][C]0.00236655227320784[/C][/ROW]
[/TABLE]
Source: https://freestatistics.org/blog/index.php?pk=201478&T=5

Globally Unique Identifier (entire table): ba.freestatistics.org/blog/index.php?pk=201478&T=5

As an alternative you can also use a QR Code:  

The GUIDs for individual cells are displayed in the table below:

Goldfeld-Quandt test for Heteroskedasticity
p-valuesAlternative Hypothesis
breakpoint indexgreater2-sidedless
160.0009860865970112670.001972173194022530.999013913402989
170.001662306595167590.003324613190335190.998337693404832
180.0008547022876158890.001709404575231780.999145297712384
190.000630984262079140.001261968524158280.999369015737921
200.001540141223445650.003080282446891290.998459858776554
210.002551320151969120.005102640303938240.997448679848031
220.01048797587460780.02097595174921560.989512024125392
230.08024299278665520.160485985573310.919757007213345
240.3848998090382380.7697996180764750.615100190961762
250.7938753967535880.4122492064928240.206124603246412
260.9862801116732420.02743977665351510.0137198883267576
270.9996802334609930.0006395330780140470.000319766539007024
280.9999973156827855.36863442996753e-062.68431721498377e-06
290.9999998933290962.133418079974e-071.066709039987e-07
300.9999999873204542.53590923738668e-081.26795461869334e-08
310.999999999224431.55114072411773e-097.75570362058866e-10
320.9999999999309881.38023107847067e-106.90115539235336e-11
330.9999999999716485.67039579400169e-112.83519789700085e-11
340.999999999945491.09020768479309e-105.45103842396545e-11
350.9999999999732455.3510827601246e-112.6755413800623e-11
360.9999999999191061.61788480891111e-108.08942404455555e-11
370.9999999996921666.15668027082943e-103.07834013541472e-10
380.9999999987515332.49693425327649e-091.24846712663825e-09
390.999999996580656.8387005447353e-093.41935027236765e-09
400.9999999938590041.22819921069175e-086.14099605345875e-09
410.9999999809297193.81405621054749e-081.90702810527374e-08
420.999999990648271.8703459334527e-089.35172966726348e-09
430.9999999937868531.24262943618448e-086.21314718092242e-09
440.9999999875408432.49183140561973e-081.24591570280987e-08
450.9999999710670575.78658852125607e-082.89329426062804e-08
460.9999999356041421.28791716608527e-076.43958583042637e-08
470.999999931931631.36136739610303e-076.80683698051514e-08
480.9999996490314157.01937170439255e-073.50968585219627e-07
490.9999985748070462.85038590741593e-061.42519295370796e-06
500.9999967093152546.58136949112487e-063.29068474556244e-06
510.9999932393472311.3521305536901e-056.76065276845049e-06
520.9999479952973980.0001040094052050055.20047026025025e-05
530.9996922215168040.0006155569663918480.000307778483195924
540.9976334477267920.004733104546415680.00236655227320784


Meta Analysis of Goldfeld-Quandt test for Heteroskedasticity
Description# significant tests% significant testsOK/NOK
1% type I error level340.871794871794872NOK
5% type I error level360.923076923076923NOK
10% type I error level360.923076923076923NOK

\begin{tabular}{lllllllll}
\hline
Meta Analysis of Goldfeld-Quandt test for Heteroskedasticity \tabularnewline
Description & # significant tests & % significant tests & OK/NOK \tabularnewline
1% type I error level & 34 & 0.871794871794872 & NOK \tabularnewline
5% type I error level & 36 & 0.923076923076923 & NOK \tabularnewline
10% type I error level & 36 & 0.923076923076923 & NOK \tabularnewline
\hline
\end{tabular}
%Source: https://freestatistics.org/blog/index.php?pk=201478&T=6

[TABLE]
[ROW][C]Meta Analysis of Goldfeld-Quandt test for Heteroskedasticity[/C][/ROW]
[ROW][C]Description[/C][C]# significant tests[/C][C]% significant tests[/C][C]OK/NOK[/C][/ROW]
[ROW][C]1% type I error level[/C][C]34[/C][C]0.871794871794872[/C][C]NOK[/C][/ROW]
[ROW][C]5% type I error level[/C][C]36[/C][C]0.923076923076923[/C][C]NOK[/C][/ROW]
[ROW][C]10% type I error level[/C][C]36[/C][C]0.923076923076923[/C][C]NOK[/C][/ROW]
[/TABLE]
Source: https://freestatistics.org/blog/index.php?pk=201478&T=6

Globally Unique Identifier (entire table): ba.freestatistics.org/blog/index.php?pk=201478&T=6

As an alternative you can also use a QR Code:  

The GUIDs for individual cells are displayed in the table below:

Meta Analysis of Goldfeld-Quandt test for Heteroskedasticity
Description# significant tests% significant testsOK/NOK
1% type I error level340.871794871794872NOK
5% type I error level360.923076923076923NOK
10% type I error level360.923076923076923NOK


Parameters (Session):
par1 = 1 ; par2 = Include Monthly Dummies ; par3 = Linear Trend ;
Parameters (R input):
par1 = 1 ; par2 = Include Monthly Dummies ; par3 = Linear Trend ;
R code (references can be found in the software module):
library(lattice)
library(lmtest)
n25 <- 25 #minimum number of obs. for Goldfeld-Quandt test
par1 <- as.numeric(par1)
x <- t(y)
k <- length(x[1,])
n <- length(x[,1])
x1 <- cbind(x[,par1], x[,1:k!=par1])
mycolnames <- c(colnames(x)[par1], colnames(x)[1:k!=par1])
colnames(x1) <- mycolnames #colnames(x)[par1]
x <- x1
if (par3 == 'First Differences'){
x2 <- array(0, dim=c(n-1,k), dimnames=list(1:(n-1), paste('(1-B)',colnames(x),sep='')))
for (i in 1:n-1) {
for (j in 1:k) {
x2[i,j] <- x[i+1,j] - x[i,j]
}
}
x <- x2
}
if (par2 == 'Include Monthly Dummies'){
x2 <- array(0, dim=c(n,11), dimnames=list(1:n, paste('M', seq(1:11), sep ='')))
for (i in 1:11){
x2[seq(i,n,12),i] <- 1
}
x <- cbind(x, x2)
}
if (par2 == 'Include Quarterly Dummies'){
x2 <- array(0, dim=c(n,3), dimnames=list(1:n, paste('Q', seq(1:3), sep ='')))
for (i in 1:3){
x2[seq(i,n,4),i] <- 1
}
x <- cbind(x, x2)
}
k <- length(x[1,])
if (par3 == 'Linear Trend'){
x <- cbind(x, c(1:n))
colnames(x)[k+1] <- 't'
}
x
k <- length(x[1,])
df <- as.data.frame(x)
(mylm <- lm(df))
(mysum <- summary(mylm))
if (n > n25) {
kp3 <- k + 3
nmkm3 <- n - k - 3
gqarr <- array(NA, dim=c(nmkm3-kp3+1,3))
numgqtests <- 0
numsignificant1 <- 0
numsignificant5 <- 0
numsignificant10 <- 0
for (mypoint in kp3:nmkm3) {
j <- 0
numgqtests <- numgqtests + 1
for (myalt in c('greater', 'two.sided', 'less')) {
j <- j + 1
gqarr[mypoint-kp3+1,j] <- gqtest(mylm, point=mypoint, alternative=myalt)$p.value
}
if (gqarr[mypoint-kp3+1,2] < 0.01) numsignificant1 <- numsignificant1 + 1
if (gqarr[mypoint-kp3+1,2] < 0.05) numsignificant5 <- numsignificant5 + 1
if (gqarr[mypoint-kp3+1,2] < 0.10) numsignificant10 <- numsignificant10 + 1
}
gqarr
}
bitmap(file='test0.png')
plot(x[,1], type='l', main='Actuals and Interpolation', ylab='value of Actuals and Interpolation (dots)', xlab='time or index')
points(x[,1]-mysum$resid)
grid()
dev.off()
bitmap(file='test1.png')
plot(mysum$resid, type='b', pch=19, main='Residuals', ylab='value of Residuals', xlab='time or index')
grid()
dev.off()
bitmap(file='test2.png')
hist(mysum$resid, main='Residual Histogram', xlab='values of Residuals')
grid()
dev.off()
bitmap(file='test3.png')
densityplot(~mysum$resid,col='black',main='Residual Density Plot', xlab='values of Residuals')
dev.off()
bitmap(file='test4.png')
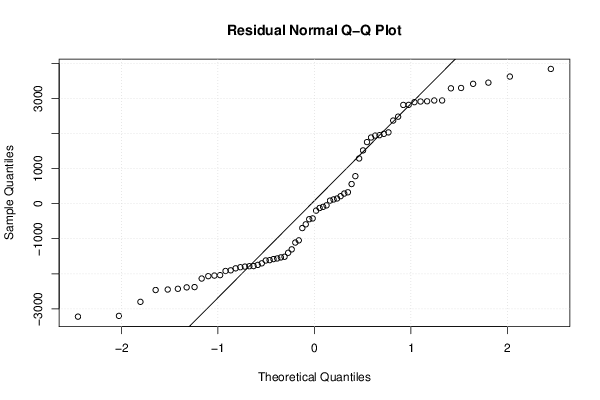
qqnorm(mysum$resid, main='Residual Normal Q-Q Plot')
qqline(mysum$resid)
grid()
dev.off()
(myerror <- as.ts(mysum$resid))
bitmap(file='test5.png')
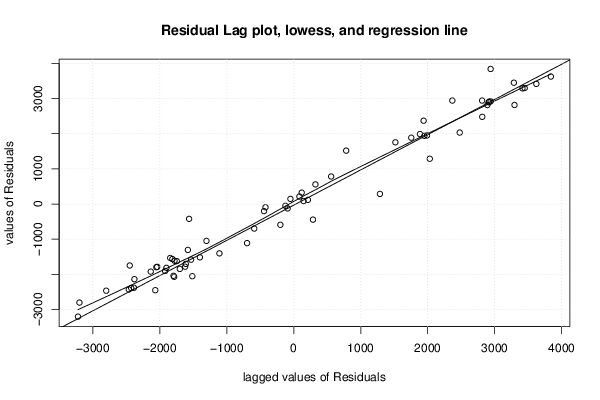
dum <- cbind(lag(myerror,k=1),myerror)
dum
dum1 <- dum[2:length(myerror),]
dum1
z <- as.data.frame(dum1)
z
plot(z,main=paste('Residual Lag plot, lowess, and regression line'), ylab='values of Residuals', xlab='lagged values of Residuals')
lines(lowess(z))
abline(lm(z))
grid()
dev.off()
bitmap(file='test6.png')
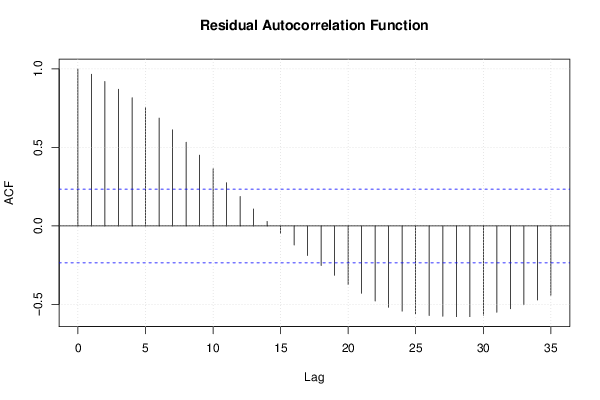
acf(mysum$resid, lag.max=length(mysum$resid)/2, main='Residual Autocorrelation Function')
grid()
dev.off()
bitmap(file='test7.png')
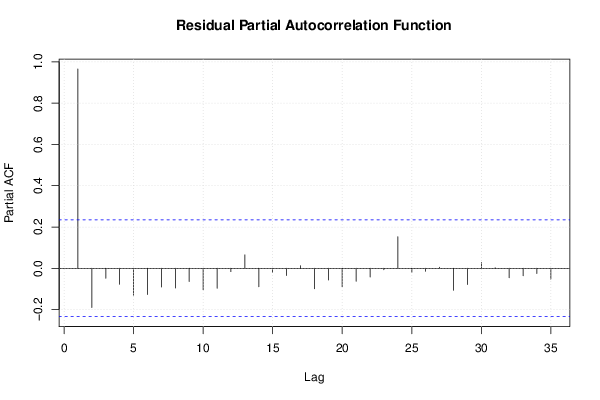
pacf(mysum$resid, lag.max=length(mysum$resid)/2, main='Residual Partial Autocorrelation Function')
grid()
dev.off()
bitmap(file='test8.png')
opar <- par(mfrow = c(2,2), oma = c(0, 0, 1.1, 0))
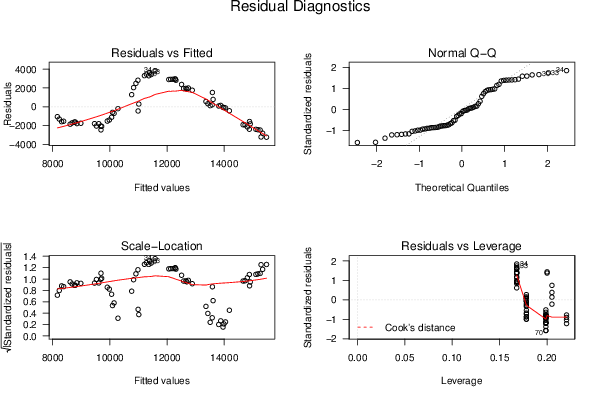
plot(mylm, las = 1, sub='Residual Diagnostics')
par(opar)
dev.off()
if (n > n25) {
bitmap(file='test9.png')
plot(kp3:nmkm3,gqarr[,2], main='Goldfeld-Quandt test',ylab='2-sided p-value',xlab='breakpoint')
grid()
dev.off()
}
load(file='createtable')
a<-table.start()
a<-table.row.start(a)
a<-table.element(a, 'Multiple Linear Regression - Estimated Regression Equation', 1, TRUE)
a<-table.row.end(a)
myeq <- colnames(x)[1]
myeq <- paste(myeq, '[t] = ', sep='')
for (i in 1:k){
if (mysum$coefficients[i,1] > 0) myeq <- paste(myeq, '+', '')
myeq <- paste(myeq, mysum$coefficients[i,1], sep=' ')
if (rownames(mysum$coefficients)[i] != '(Intercept)') {
myeq <- paste(myeq, rownames(mysum$coefficients)[i], sep='')
if (rownames(mysum$coefficients)[i] != 't') myeq <- paste(myeq, '[t]', sep='')
}
}
myeq <- paste(myeq, ' + e[t]')
a<-table.row.start(a)
a<-table.element(a, myeq)
a<-table.row.end(a)
a<-table.end(a)
table.save(a,file='mytable1.tab')
a<-table.start()
a<-table.row.start(a)
a<-table.element(a,hyperlink('ols1.htm','Multiple Linear Regression - Ordinary Least Squares',''), 6, TRUE)
a<-table.row.end(a)
a<-table.row.start(a)
a<-table.element(a,'Variable',header=TRUE)
a<-table.element(a,'Parameter',header=TRUE)
a<-table.element(a,'S.D.',header=TRUE)
a<-table.element(a,'T-STAT
H0: parameter = 0',header=TRUE)
a<-table.element(a,'2-tail p-value',header=TRUE)
a<-table.element(a,'1-tail p-value',header=TRUE)
a<-table.row.end(a)
for (i in 1:k){
a<-table.row.start(a)
a<-table.element(a,rownames(mysum$coefficients)[i],header=TRUE)
a<-table.element(a,mysum$coefficients[i,1])
a<-table.element(a, round(mysum$coefficients[i,2],6))
a<-table.element(a, round(mysum$coefficients[i,3],4))
a<-table.element(a, round(mysum$coefficients[i,4],6))
a<-table.element(a, round(mysum$coefficients[i,4]/2,6))
a<-table.row.end(a)
}
a<-table.end(a)
table.save(a,file='mytable2.tab')
a<-table.start()
a<-table.row.start(a)
a<-table.element(a, 'Multiple Linear Regression - Regression Statistics', 2, TRUE)
a<-table.row.end(a)
a<-table.row.start(a)
a<-table.element(a, 'Multiple R',1,TRUE)
a<-table.element(a, sqrt(mysum$r.squared))
a<-table.row.end(a)
a<-table.row.start(a)
a<-table.element(a, 'R-squared',1,TRUE)
a<-table.element(a, mysum$r.squared)
a<-table.row.end(a)
a<-table.row.start(a)
a<-table.element(a, 'Adjusted R-squared',1,TRUE)
a<-table.element(a, mysum$adj.r.squared)
a<-table.row.end(a)
a<-table.row.start(a)
a<-table.element(a, 'F-TEST (value)',1,TRUE)
a<-table.element(a, mysum$fstatistic[1])
a<-table.row.end(a)
a<-table.row.start(a)
a<-table.element(a, 'F-TEST (DF numerator)',1,TRUE)
a<-table.element(a, mysum$fstatistic[2])
a<-table.row.end(a)
a<-table.row.start(a)
a<-table.element(a, 'F-TEST (DF denominator)',1,TRUE)
a<-table.element(a, mysum$fstatistic[3])
a<-table.row.end(a)
a<-table.row.start(a)
a<-table.element(a, 'p-value',1,TRUE)
a<-table.element(a, 1-pf(mysum$fstatistic[1],mysum$fstatistic[2],mysum$fstatistic[3]))
a<-table.row.end(a)
a<-table.row.start(a)
a<-table.element(a, 'Multiple Linear Regression - Residual Statistics', 2, TRUE)
a<-table.row.end(a)
a<-table.row.start(a)
a<-table.element(a, 'Residual Standard Deviation',1,TRUE)
a<-table.element(a, mysum$sigma)
a<-table.row.end(a)
a<-table.row.start(a)
a<-table.element(a, 'Sum Squared Residuals',1,TRUE)
a<-table.element(a, sum(myerror*myerror))
a<-table.row.end(a)
a<-table.end(a)
table.save(a,file='mytable3.tab')
a<-table.start()
a<-table.row.start(a)
a<-table.element(a, 'Multiple Linear Regression - Actuals, Interpolation, and Residuals', 4, TRUE)
a<-table.row.end(a)
a<-table.row.start(a)
a<-table.element(a, 'Time or Index', 1, TRUE)
a<-table.element(a, 'Actuals', 1, TRUE)
a<-table.element(a, 'Interpolation
Forecast', 1, TRUE)
a<-table.element(a, 'Residuals
Prediction Error', 1, TRUE)
a<-table.row.end(a)
for (i in 1:n) {
a<-table.row.start(a)
a<-table.element(a,i, 1, TRUE)
a<-table.element(a,x[i])
a<-table.element(a,x[i]-mysum$resid[i])
a<-table.element(a,mysum$resid[i])
a<-table.row.end(a)
}
a<-table.end(a)
table.save(a,file='mytable4.tab')
if (n > n25) {
a<-table.start()
a<-table.row.start(a)
a<-table.element(a,'Goldfeld-Quandt test for Heteroskedasticity',4,TRUE)
a<-table.row.end(a)
a<-table.row.start(a)
a<-table.element(a,'p-values',header=TRUE)
a<-table.element(a,'Alternative Hypothesis',3,header=TRUE)
a<-table.row.end(a)
a<-table.row.start(a)
a<-table.element(a,'breakpoint index',header=TRUE)
a<-table.element(a,'greater',header=TRUE)
a<-table.element(a,'2-sided',header=TRUE)
a<-table.element(a,'less',header=TRUE)
a<-table.row.end(a)
for (mypoint in kp3:nmkm3) {
a<-table.row.start(a)
a<-table.element(a,mypoint,header=TRUE)
a<-table.element(a,gqarr[mypoint-kp3+1,1])
a<-table.element(a,gqarr[mypoint-kp3+1,2])
a<-table.element(a,gqarr[mypoint-kp3+1,3])
a<-table.row.end(a)
}
a<-table.end(a)
table.save(a,file='mytable5.tab')
a<-table.start()
a<-table.row.start(a)
a<-table.element(a,'Meta Analysis of Goldfeld-Quandt test for Heteroskedasticity',4,TRUE)
a<-table.row.end(a)
a<-table.row.start(a)
a<-table.element(a,'Description',header=TRUE)
a<-table.element(a,'# significant tests',header=TRUE)
a<-table.element(a,'% significant tests',header=TRUE)
a<-table.element(a,'OK/NOK',header=TRUE)
a<-table.row.end(a)
a<-table.row.start(a)
a<-table.element(a,'1% type I error level',header=TRUE)
a<-table.element(a,numsignificant1)
a<-table.element(a,numsignificant1/numgqtests)
if (numsignificant1/numgqtests < 0.01) dum <- 'OK' else dum <- 'NOK'
a<-table.element(a,dum)
a<-table.row.end(a)
a<-table.row.start(a)
a<-table.element(a,'5% type I error level',header=TRUE)
a<-table.element(a,numsignificant5)
a<-table.element(a,numsignificant5/numgqtests)
if (numsignificant5/numgqtests < 0.05) dum <- 'OK' else dum <- 'NOK'
a<-table.element(a,dum)
a<-table.row.end(a)
a<-table.row.start(a)
a<-table.element(a,'10% type I error level',header=TRUE)
a<-table.element(a,numsignificant10)
a<-table.element(a,numsignificant10/numgqtests)
if (numsignificant10/numgqtests < 0.1) dum <- 'OK' else dum <- 'NOK'
a<-table.element(a,dum)
a<-table.row.end(a)
a<-table.end(a)
table.save(a,file='mytable6.tab')
}