| Tabulation of Results | ||
| T40 x T20 | ||
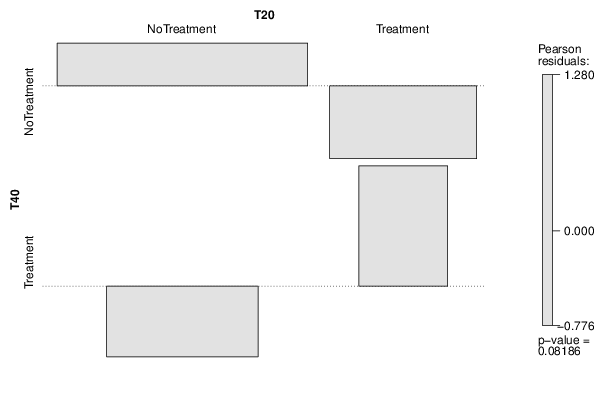
| NoTreatment | Treatment | NoTreatment | 50 | 13 | Treatment | 14 | 9 |
| Tabulation of Expected Results | ||
| T40 x T20 | ||
| NoTreatment | Treatment | NoTreatment | 46.88 | 16.12 | Treatment | 17.12 | 5.88 |
| Statistical Results | |
| Pearson's Chi-squared test with simulated p-value (based on 2000 replicates) | |
| Exact Pearson Chi Square Statistic | 3.03 |
| P value | 0.09 |