Free Statistics
of Irreproducible Research!
Description of Statistical Computation | |||||||||||||||||||||||||||||||||||||||||||||||||||||||||||||||||||||||||||||||||||||||||||||||||||||||||||||||||||||||||||||||||||||||||||||||||||||||||||||||||||||||||||||||||||||||||||||||||||||||||||||||||||||||||||||||||||||||||||||||||||||||||||||||||||||||||||||||||||||||||||||||||||||||||||||||||||||||||||||||||||||||||||||||||||||||||||||||||||||||||||||||||||||||||||||||||||||
|---|---|---|---|---|---|---|---|---|---|---|---|---|---|---|---|---|---|---|---|---|---|---|---|---|---|---|---|---|---|---|---|---|---|---|---|---|---|---|---|---|---|---|---|---|---|---|---|---|---|---|---|---|---|---|---|---|---|---|---|---|---|---|---|---|---|---|---|---|---|---|---|---|---|---|---|---|---|---|---|---|---|---|---|---|---|---|---|---|---|---|---|---|---|---|---|---|---|---|---|---|---|---|---|---|---|---|---|---|---|---|---|---|---|---|---|---|---|---|---|---|---|---|---|---|---|---|---|---|---|---|---|---|---|---|---|---|---|---|---|---|---|---|---|---|---|---|---|---|---|---|---|---|---|---|---|---|---|---|---|---|---|---|---|---|---|---|---|---|---|---|---|---|---|---|---|---|---|---|---|---|---|---|---|---|---|---|---|---|---|---|---|---|---|---|---|---|---|---|---|---|---|---|---|---|---|---|---|---|---|---|---|---|---|---|---|---|---|---|---|---|---|---|---|---|---|---|---|---|---|---|---|---|---|---|---|---|---|---|---|---|---|---|---|---|---|---|---|---|---|---|---|---|---|---|---|---|---|---|---|---|---|---|---|---|---|---|---|---|---|---|---|---|---|---|---|---|---|---|---|---|---|---|---|---|---|---|---|---|---|---|---|---|---|---|---|---|---|---|---|---|---|---|---|---|---|---|---|---|---|---|---|---|---|---|---|---|---|---|---|---|---|---|---|---|---|---|---|---|---|---|---|---|---|---|---|---|---|---|---|---|---|---|---|---|---|---|---|---|---|---|---|---|---|---|---|---|---|---|---|---|---|---|---|---|---|---|---|---|---|---|---|---|---|---|---|---|---|---|---|---|---|---|---|---|---|---|---|---|---|
| Author's title | |||||||||||||||||||||||||||||||||||||||||||||||||||||||||||||||||||||||||||||||||||||||||||||||||||||||||||||||||||||||||||||||||||||||||||||||||||||||||||||||||||||||||||||||||||||||||||||||||||||||||||||||||||||||||||||||||||||||||||||||||||||||||||||||||||||||||||||||||||||||||||||||||||||||||||||||||||||||||||||||||||||||||||||||||||||||||||||||||||||||||||||||||||||||||||||||||||||
| Author | *The author of this computation has been verified* | ||||||||||||||||||||||||||||||||||||||||||||||||||||||||||||||||||||||||||||||||||||||||||||||||||||||||||||||||||||||||||||||||||||||||||||||||||||||||||||||||||||||||||||||||||||||||||||||||||||||||||||||||||||||||||||||||||||||||||||||||||||||||||||||||||||||||||||||||||||||||||||||||||||||||||||||||||||||||||||||||||||||||||||||||||||||||||||||||||||||||||||||||||||||||||||||||||||
| R Software Module | rwasp_Two Factor ANOVA.wasp | ||||||||||||||||||||||||||||||||||||||||||||||||||||||||||||||||||||||||||||||||||||||||||||||||||||||||||||||||||||||||||||||||||||||||||||||||||||||||||||||||||||||||||||||||||||||||||||||||||||||||||||||||||||||||||||||||||||||||||||||||||||||||||||||||||||||||||||||||||||||||||||||||||||||||||||||||||||||||||||||||||||||||||||||||||||||||||||||||||||||||||||||||||||||||||||||||||||
| Title produced by software | Two-Way ANOVA | ||||||||||||||||||||||||||||||||||||||||||||||||||||||||||||||||||||||||||||||||||||||||||||||||||||||||||||||||||||||||||||||||||||||||||||||||||||||||||||||||||||||||||||||||||||||||||||||||||||||||||||||||||||||||||||||||||||||||||||||||||||||||||||||||||||||||||||||||||||||||||||||||||||||||||||||||||||||||||||||||||||||||||||||||||||||||||||||||||||||||||||||||||||||||||||||||||||
| Date of computation | Tue, 18 Dec 2012 11:23:23 -0500 | ||||||||||||||||||||||||||||||||||||||||||||||||||||||||||||||||||||||||||||||||||||||||||||||||||||||||||||||||||||||||||||||||||||||||||||||||||||||||||||||||||||||||||||||||||||||||||||||||||||||||||||||||||||||||||||||||||||||||||||||||||||||||||||||||||||||||||||||||||||||||||||||||||||||||||||||||||||||||||||||||||||||||||||||||||||||||||||||||||||||||||||||||||||||||||||||||||||
| Cite this page as follows | Statistical Computations at FreeStatistics.org, Office for Research Development and Education, URL https://freestatistics.org/blog/index.php?v=date/2012/Dec/18/t135584783069omg9krn2xbs2p.htm/, Retrieved Wed, 24 Apr 2024 16:36:10 +0000 | ||||||||||||||||||||||||||||||||||||||||||||||||||||||||||||||||||||||||||||||||||||||||||||||||||||||||||||||||||||||||||||||||||||||||||||||||||||||||||||||||||||||||||||||||||||||||||||||||||||||||||||||||||||||||||||||||||||||||||||||||||||||||||||||||||||||||||||||||||||||||||||||||||||||||||||||||||||||||||||||||||||||||||||||||||||||||||||||||||||||||||||||||||||||||||||||||||||
| Statistical Computations at FreeStatistics.org, Office for Research Development and Education, URL https://freestatistics.org/blog/index.php?pk=201484, Retrieved Wed, 24 Apr 2024 16:36:10 +0000 | |||||||||||||||||||||||||||||||||||||||||||||||||||||||||||||||||||||||||||||||||||||||||||||||||||||||||||||||||||||||||||||||||||||||||||||||||||||||||||||||||||||||||||||||||||||||||||||||||||||||||||||||||||||||||||||||||||||||||||||||||||||||||||||||||||||||||||||||||||||||||||||||||||||||||||||||||||||||||||||||||||||||||||||||||||||||||||||||||||||||||||||||||||||||||||||||||||||
| QR Codes: | |||||||||||||||||||||||||||||||||||||||||||||||||||||||||||||||||||||||||||||||||||||||||||||||||||||||||||||||||||||||||||||||||||||||||||||||||||||||||||||||||||||||||||||||||||||||||||||||||||||||||||||||||||||||||||||||||||||||||||||||||||||||||||||||||||||||||||||||||||||||||||||||||||||||||||||||||||||||||||||||||||||||||||||||||||||||||||||||||||||||||||||||||||||||||||||||||||||
|
| |||||||||||||||||||||||||||||||||||||||||||||||||||||||||||||||||||||||||||||||||||||||||||||||||||||||||||||||||||||||||||||||||||||||||||||||||||||||||||||||||||||||||||||||||||||||||||||||||||||||||||||||||||||||||||||||||||||||||||||||||||||||||||||||||||||||||||||||||||||||||||||||||||||||||||||||||||||||||||||||||||||||||||||||||||||||||||||||||||||||||||||||||||||||||||||||||||||
| Original text written by user: | |||||||||||||||||||||||||||||||||||||||||||||||||||||||||||||||||||||||||||||||||||||||||||||||||||||||||||||||||||||||||||||||||||||||||||||||||||||||||||||||||||||||||||||||||||||||||||||||||||||||||||||||||||||||||||||||||||||||||||||||||||||||||||||||||||||||||||||||||||||||||||||||||||||||||||||||||||||||||||||||||||||||||||||||||||||||||||||||||||||||||||||||||||||||||||||||||||||
| IsPrivate? | No (this computation is public) | ||||||||||||||||||||||||||||||||||||||||||||||||||||||||||||||||||||||||||||||||||||||||||||||||||||||||||||||||||||||||||||||||||||||||||||||||||||||||||||||||||||||||||||||||||||||||||||||||||||||||||||||||||||||||||||||||||||||||||||||||||||||||||||||||||||||||||||||||||||||||||||||||||||||||||||||||||||||||||||||||||||||||||||||||||||||||||||||||||||||||||||||||||||||||||||||||||||
| User-defined keywords | |||||||||||||||||||||||||||||||||||||||||||||||||||||||||||||||||||||||||||||||||||||||||||||||||||||||||||||||||||||||||||||||||||||||||||||||||||||||||||||||||||||||||||||||||||||||||||||||||||||||||||||||||||||||||||||||||||||||||||||||||||||||||||||||||||||||||||||||||||||||||||||||||||||||||||||||||||||||||||||||||||||||||||||||||||||||||||||||||||||||||||||||||||||||||||||||||||||
| Estimated Impact | 86 | ||||||||||||||||||||||||||||||||||||||||||||||||||||||||||||||||||||||||||||||||||||||||||||||||||||||||||||||||||||||||||||||||||||||||||||||||||||||||||||||||||||||||||||||||||||||||||||||||||||||||||||||||||||||||||||||||||||||||||||||||||||||||||||||||||||||||||||||||||||||||||||||||||||||||||||||||||||||||||||||||||||||||||||||||||||||||||||||||||||||||||||||||||||||||||||||||||||
Tree of Dependent Computations | |||||||||||||||||||||||||||||||||||||||||||||||||||||||||||||||||||||||||||||||||||||||||||||||||||||||||||||||||||||||||||||||||||||||||||||||||||||||||||||||||||||||||||||||||||||||||||||||||||||||||||||||||||||||||||||||||||||||||||||||||||||||||||||||||||||||||||||||||||||||||||||||||||||||||||||||||||||||||||||||||||||||||||||||||||||||||||||||||||||||||||||||||||||||||||||||||||||
| Family? (F = Feedback message, R = changed R code, M = changed R Module, P = changed Parameters, D = changed Data) | |||||||||||||||||||||||||||||||||||||||||||||||||||||||||||||||||||||||||||||||||||||||||||||||||||||||||||||||||||||||||||||||||||||||||||||||||||||||||||||||||||||||||||||||||||||||||||||||||||||||||||||||||||||||||||||||||||||||||||||||||||||||||||||||||||||||||||||||||||||||||||||||||||||||||||||||||||||||||||||||||||||||||||||||||||||||||||||||||||||||||||||||||||||||||||||||||||||
| - [Two-Way ANOVA] [2 way anova paper] [2012-12-18 16:23:23] [239167cccea8953a8e1721fd6db07280] [Current] | |||||||||||||||||||||||||||||||||||||||||||||||||||||||||||||||||||||||||||||||||||||||||||||||||||||||||||||||||||||||||||||||||||||||||||||||||||||||||||||||||||||||||||||||||||||||||||||||||||||||||||||||||||||||||||||||||||||||||||||||||||||||||||||||||||||||||||||||||||||||||||||||||||||||||||||||||||||||||||||||||||||||||||||||||||||||||||||||||||||||||||||||||||||||||||||||||||||
| Feedback Forum | |||||||||||||||||||||||||||||||||||||||||||||||||||||||||||||||||||||||||||||||||||||||||||||||||||||||||||||||||||||||||||||||||||||||||||||||||||||||||||||||||||||||||||||||||||||||||||||||||||||||||||||||||||||||||||||||||||||||||||||||||||||||||||||||||||||||||||||||||||||||||||||||||||||||||||||||||||||||||||||||||||||||||||||||||||||||||||||||||||||||||||||||||||||||||||||||||||||
Post a new message | |||||||||||||||||||||||||||||||||||||||||||||||||||||||||||||||||||||||||||||||||||||||||||||||||||||||||||||||||||||||||||||||||||||||||||||||||||||||||||||||||||||||||||||||||||||||||||||||||||||||||||||||||||||||||||||||||||||||||||||||||||||||||||||||||||||||||||||||||||||||||||||||||||||||||||||||||||||||||||||||||||||||||||||||||||||||||||||||||||||||||||||||||||||||||||||||||||||
Dataset | |||||||||||||||||||||||||||||||||||||||||||||||||||||||||||||||||||||||||||||||||||||||||||||||||||||||||||||||||||||||||||||||||||||||||||||||||||||||||||||||||||||||||||||||||||||||||||||||||||||||||||||||||||||||||||||||||||||||||||||||||||||||||||||||||||||||||||||||||||||||||||||||||||||||||||||||||||||||||||||||||||||||||||||||||||||||||||||||||||||||||||||||||||||||||||||||||||||
| Dataseries X: | |||||||||||||||||||||||||||||||||||||||||||||||||||||||||||||||||||||||||||||||||||||||||||||||||||||||||||||||||||||||||||||||||||||||||||||||||||||||||||||||||||||||||||||||||||||||||||||||||||||||||||||||||||||||||||||||||||||||||||||||||||||||||||||||||||||||||||||||||||||||||||||||||||||||||||||||||||||||||||||||||||||||||||||||||||||||||||||||||||||||||||||||||||||||||||||||||||||
4 'Yes' 'Treatment' NA 'NoStats' 'No' 'No' 'Good' 4 'No' 'NoTreatment' NA 'NoStats' 'No' 'No' 'Bad' 4 'No' 'NoTreatment' NA 'NoStats' 'No' 'No' 'Bad' 4 'No' 'NoTreatment' NA 'NoStats' 'No' 'No' 'Bad' 4 'No' 'NoTreatment' NA 'NoStats' 'No' 'No' 'Bad' 4 'Yes' 'NoTreatment' NA 'NoStats' 'No' 'Yes' 'Good' 4 'No' 'NoTreatment' NA 'NoStats' 'No' 'No' 'Bad' 4 'No' 'Treatment' NA 'NoStats' 'No' 'No' 'Bad' 4 'No' 'NoTreatment' NA 'NoStats' 'No' 'No' 'Good' 4 'Yes' 'NoTreatment' NA 'NoStats' 'No' 'No' 'Bad' 4 'Yes' 'Treatment' NA 'NoStats' 'No' 'No' 'Bad' 4 'No' 'NoTreatment' NA 'NoStats' 'No' 'No' 'Bad' 4 'No' 'NoTreatment' NA 'UsedStats' 'No' 'Yes' 'Bad' 4 'Yes' 'Treatment' NA 'NoStats' 'No' 'No' 'Bad' 4 'No' 'NoTreatment' NA 'UsedStats' 'No' 'Yes' 'Good' 4 'No' 'Treatment' NA 'UsedStats' 'No' 'Yes' 'Good' 4 'Yes' 'Treatment' NA 'UsedStats' 'Yes' 'Yes' 'Bad' 4 'Yes' 'Treatment' NA 'NoStats' 'No' 'No' 'Bad' 4 'No' 'NoTreatment' NA 'NoStats' 'No' 'No' 'Good' 4 'No' 'Treatment' NA 'UsedStats' 'Yes' 'Yes' 'Good' 4 'Yes' 'NoTreatment' NA 'NoStats' 'No' 'Yes' 'Bad' 4 'Yes' 'NoTreatment' NA 'UsedStats' 'No' 'Yes' 'Good' 4 'No' 'NoTreatment' NA 'NoStats' 'No' 'Yes' 'Good' 4 'Yes' 'NoTreatment' NA 'NoStats' 'No' 'Yes' 'Good' 4 'No' 'Treatment' NA 'UsedStats' 'No' 'No' 'Good' 4 'No' 'NoTreatment' NA 'UsedStats' 'No' 'Yes' 'Bad' 4 'Yes' 'NoTreatment' NA 'NoStats' 'No' 'No' 'Good' 4 'No' 'NoTreatment' NA 'UsedStats' 'No' 'No' 'Bad' 4 'No' 'NoTreatment' NA 'NoStats' 'No' 'No' 'Good' 4 'No' 'NoTreatment' NA 'NoStats' 'No' 'Yes' 'Bad' 4 'No' 'NoTreatment' NA 'NoStats' 'No' 'No' 'Bad' 4 'Yes' 'NoTreatment' NA 'NoStats' 'No' 'No' 'Bad' 4 'Yes' 'NoTreatment' NA 'NoStats' 'No' 'Yes' 'Bad' 4 'No' 'Treatment' NA 'NoStats' 'No' 'No' 'Good' 4 'No' 'NoTreatment' NA 'NoStats' 'No' 'No' 'Bad' 4 'No' 'NoTreatment' NA 'NoStats' 'No' 'No' 'Bad' 4 'Yes' 'Treatment' NA 'UsedStats' 'No' 'Yes' 'Bad' 4 'No' 'NoTreatment' NA 'UsedStats' 'No' 'No' 'Good' 4 'No' 'NoTreatment' NA 'NoStats' 'No' 'Yes' 'Good' 4 'No' 'Treatment' NA 'NoStats' 'No' 'Yes' 'Bad' 4 'No' 'NoTreatment' NA 'UsedStats' 'Yes' 'Yes' 'Good' 4 'No' 'NoTreatment' NA 'UsedStats' 'No' 'No' 'Good' 4 'Yes' 'NoTreatment' NA 'NoStats' 'No' 'Yes' 'Good' 4 'Yes' 'Treatment' NA 'NoStats' 'No' 'No' 'Bad' 4 'No' 'NoTreatment' NA 'NoStats' 'No' 'Yes' 'Bad' 4 'No' 'NoTreatment' NA 'NoStats' 'No' 'Yes' 'Good' 4 'No' 'NoTreatment' NA 'NoStats' 'No' 'No' 'Bad' 4 'No' 'NoTreatment' NA 'NoStats' 'No' 'No' 'Good' 4 'No' 'NoTreatment' NA 'NoStats' 'No' 'Yes' 'Good' 4 'No' 'NoTreatment' NA 'NoStats' 'No' 'No' 'Bad' 4 'No' 'Treatment' NA 'UsedStats' 'No' 'No' 'Bad' 4 'Yes' 'Treatment' NA 'UsedStats' 'Yes' 'Yes' 'Bad' 4 'No' 'NoTreatment' NA 'NoStats' 'No' 'No' 'Good' 4 'No' 'NoTreatment' NA 'UsedStats' 'Yes' 'No' 'Bad' 4 'No' 'NoTreatment' NA 'NoStats' 'No' 'No' 'Bad' 4 'No' 'Treatment' NA 'UsedStats' 'No' 'No' 'Good' 4 'No' 'NoTreatment' NA 'UsedStats' 'No' 'Yes' 'Good' 4 'No' 'NoTreatment' NA 'NoStats' 'No' 'No' 'Good' 4 'No' 'NoTreatment' NA 'NoStats' 'No' 'No' 'Good' 4 'Yes' 'Treatment' NA 'UsedStats' 'Yes' 'Yes' 'Good' 4 'Yes' 'Treatment' NA 'NoStats' 'No' 'No' 'Good' 4 'No' 'NoTreatment' NA 'UsedStats' 'No' 'Yes' 'Bad' 4 'No' 'NoTreatment' NA 'NoStats' 'No' 'No' 'Bad' 4 'Yes' 'Treatment' NA 'NoStats' 'No' 'No' 'Good' 4 'No' 'NoTreatment' NA 'NoStats' 'No' 'No' 'Bad' 4 'No' 'NoTreatment' NA 'NoStats' 'No' 'No' 'Bad' 4 'No' 'Treatment' NA 'UsedStats' 'Yes' 'Yes' 'Bad' 4 'Yes' 'NoTreatment' NA 'NoStats' 'No' 'No' 'Bad' 4 'No' 'NoTreatment' NA 'NoStats' 'No' 'No' 'Good' 4 'No' 'NoTreatment' NA 'UsedStats' 'No' 'No' 'Bad' 4 'No' 'NoTreatment' NA 'NoStats' 'No' 'No' 'Bad' 4 'No' 'NoTreatment' NA 'NoStats' 'No' 'No' 'Good' 4 'No' 'NoTreatment' NA 'UsedStats' 'No' 'No' 'Good' 4 'Yes' 'NoTreatment' NA 'UsedStats' 'No' 'No' 'Bad' 4 'No' 'NoTreatment' NA 'NoStats' 'No' 'No' 'Good' 4 'No' 'Treatment' NA 'NoStats' 'No' 'Yes' 'Good' 4 'No' 'NoTreatment' NA 'NoStats' 'No' 'No' 'Good' 4 'No' 'NoTreatment' NA 'UsedStats' 'No' 'Yes' 'Good' 4 'No' 'Treatment' NA 'UsedStats' 'Yes' 'No' 'Good' 4 'No' 'Treatment' NA 'NoStats' 'No' 'Yes' 'Bad' 4 'No' 'NoTreatment' NA 'NoStats' 'No' 'No' 'Bad' 4 'Yes' 'NoTreatment' NA 'UsedStats' 'No' 'No' 'Good' 4 'No' 'NoTreatment' NA 'NoStats' 'No' 'No' 'Bad' 4 'No' 'NoTreatment' NA 'UsedStats' 'Yes' 'No' 'Bad' 4 'No' 'NoTreatment' NA 'NoStats' 'No' 'Yes' 'Good' 4 'Yes' 'NoTreatment' NA 'NoStats' 'No' 'No' 'Bad' 2 'Yes' NA 'NoTreatment' 'NoStats' 'No' 'No' 'Good' 2 'Yes' NA 'Treatment' 'UsedStats' 'No' 'No' 'Good' 2 'No' NA 'NoTreatment' 'NoStats' 'No' 'No' 'Bad' 2 'No' NA 'NoTreatment' 'NoStats' 'No' 'No' 'Good' 2 'No' NA 'NoTreatment' 'NoStats' 'No' 'Yes' 'Bad' 2 'Yes' NA 'Treatment' 'NoStats' 'No' 'No' 'Bad' 2 'Yes' NA 'NoTreatment' 'NoStats' 'No' 'Yes' 'Bad' 2 'No' NA 'NoTreatment' 'NoStats' 'No' 'No' 'Bad' 2 'No' NA 'Treatment' 'NoStats' 'No' 'No' 'Bad' 2 'No' NA 'NoTreatment' 'NoStats' 'No' 'No' 'Good' 2 'Yes' NA 'Treatment' 'NoStats' 'No' 'No' 'Bad' 2 'No' NA 'NoTreatment' 'NoStats' 'No' 'No' 'Bad' 2 'Yes' NA 'NoTreatment' 'NoStats' 'No' 'No' 'Bad' 2 'No' NA 'NoTreatment' 'NoStats' 'No' 'No' 'Good' 2 'Yes' NA 'NoTreatment' 'NoStats' 'No' 'No' 'Good' 2 'No' NA 'NoTreatment' 'NoStats' 'No' 'No' 'Bad' 2 'No' NA 'NoTreatment' 'NoStats' 'No' 'No' 'Bad' 2 'No' NA 'NoTreatment' 'NoStats' 'No' 'No' 'Bad' 2 'No' NA 'Treatment' 'UsedStats' 'No' 'No' 'Bad' 2 'No' NA 'NoTreatment' 'NoStats' 'No' 'No' 'Bad' 2 'No' NA 'NoTreatment' 'NoStats' 'No' 'No' 'Bad' 2 'Yes' NA 'Treatment' 'UsedStats' 'No' 'No' 'Bad' 2 'No' NA 'NoTreatment' 'NoStats' 'No' 'No' 'Bad' 2 'Yes' NA 'NoTreatment' 'NoStats' 'No' 'No' 'Bad' 2 'Yes' NA 'Treatment' 'UsedStats' 'No' 'Yes' 'Bad' 2 'No' NA 'Treatment' 'NoStats' 'No' 'No' 'Bad' 2 'No' NA 'NoTreatment' 'UsedStats' 'No' 'No' 'Bad' 2 'Yes' NA 'Treatment' 'UsedStats' 'No' 'No' 'Bad' 2 'Yes' NA 'NoTreatment' 'NoStats' 'No' 'No' 'Bad' 2 'No' NA 'NoTreatment' 'NoStats' 'No' 'No' 'Bad' 2 'Yes' NA 'NoTreatment' 'NoStats' 'No' 'No' 'Good' 2 'Yes' NA 'NoTreatment' 'NoStats' 'No' 'No' 'Bad' 2 'No' NA 'NoTreatment' 'NoStats' 'No' 'No' 'Bad' 2 'No' NA 'NoTreatment' 'NoStats' 'No' 'No' 'Good' 2 'Yes' NA 'NoTreatment' 'NoStats' 'No' 'No' 'Bad' 2 'No' NA 'NoTreatment' 'NoStats' 'No' 'No' 'Bad' 2 'Yes' NA 'Treatment' 'UsedStats' 'No' 'No' 'Bad' 2 'No' NA 'NoTreatment' 'UsedStats' 'No' 'Yes' 'Good' 2 'No' NA 'NoTreatment' 'NoStats' 'No' 'No' 'Good' 2 'No' NA 'Treatment' 'NoStats' 'No' 'No' 'Bad' 2 'No' NA 'NoTreatment' 'NoStats' 'No' 'Yes' 'Bad' 2 'No' NA 'NoTreatment' 'NoStats' 'No' 'No' 'Good' 2 'No' NA 'NoTreatment' 'NoStats' 'No' 'No' 'Bad' 2 'No' NA 'NoTreatment' 'NoStats' 'No' 'No' 'Good' 2 'Yes' NA 'NoTreatment' 'NoStats' 'No' 'No' 'Bad' 2 'Yes' NA 'NoTreatment' 'NoStats' 'No' 'No' 'Good' 2 'Yes' NA 'NoTreatment' 'UsedStats' 'No' 'No' 'Bad' 2 'No' NA 'NoTreatment' 'NoStats' 'No' 'No' 'Bad' 2 'No' NA 'NoTreatment' 'NoStats' 'No' 'No' 'Bad' 2 'No' NA 'NoTreatment' 'NoStats' 'No' 'No' 'Bad' 2 'Yes' NA 'NoTreatment' 'UsedStats' 'No' 'Yes' 'Good' 2 'Yes' NA 'Treatment' 'UsedStats' 'No' 'Yes' 'Good' 2 'No' NA 'Treatment' 'NoStats' 'No' 'No' 'Bad' 2 'No' NA 'NoTreatment' 'NoStats' 'No' 'No' 'Bad' 2 'No' NA 'NoTreatment' 'UsedStats' 'Yes' 'No' 'Good' 2 'No' NA 'Treatment' 'UsedStats' 'No' 'No' 'Good' 2 'Yes' NA 'NoTreatment' 'NoStats' 'No' 'No' 'Bad' 2 'No' NA 'NoTreatment' 'NoStats' 'No' 'Yes' 'Good' 2 'No' NA 'NoTreatment' 'NoStats' 'No' 'Yes' 'Bad' 2 'No' NA 'Treatment' 'NoStats' 'No' 'No' 'Good' 2 'No' NA 'Treatment' 'UsedStats' 'No' 'No' 'Bad' 2 'No' NA 'Treatment' 'NoStats' 'No' 'No' 'Bad' 2 'Yes' NA 'NoTreatment' 'NoStats' 'No' 'No' 'Bad' 2 'No' NA 'NoTreatment' 'NoStats' 'No' 'Yes' 'Good' 2 'No' NA 'NoTreatment' 'NoStats' 'No' 'No' 'Good' 2 'Yes' NA 'NoTreatment' 'UsedStats' 'Yes' 'No' 'Bad' 2 'Yes' NA 'NoTreatment' 'UsedStats' 'Yes' 'Yes' 'Bad' 2 'Yes' NA 'NoTreatment' 'UsedStats' 'No' 'No' 'Bad' | |||||||||||||||||||||||||||||||||||||||||||||||||||||||||||||||||||||||||||||||||||||||||||||||||||||||||||||||||||||||||||||||||||||||||||||||||||||||||||||||||||||||||||||||||||||||||||||||||||||||||||||||||||||||||||||||||||||||||||||||||||||||||||||||||||||||||||||||||||||||||||||||||||||||||||||||||||||||||||||||||||||||||||||||||||||||||||||||||||||||||||||||||||||||||||||||||||||
Tables (Output of Computation) | |||||||||||||||||||||||||||||||||||||||||||||||||||||||||||||||||||||||||||||||||||||||||||||||||||||||||||||||||||||||||||||||||||||||||||||||||||||||||||||||||||||||||||||||||||||||||||||||||||||||||||||||||||||||||||||||||||||||||||||||||||||||||||||||||||||||||||||||||||||||||||||||||||||||||||||||||||||||||||||||||||||||||||||||||||||||||||||||||||||||||||||||||||||||||||||||||||||
| |||||||||||||||||||||||||||||||||||||||||||||||||||||||||||||||||||||||||||||||||||||||||||||||||||||||||||||||||||||||||||||||||||||||||||||||||||||||||||||||||||||||||||||||||||||||||||||||||||||||||||||||||||||||||||||||||||||||||||||||||||||||||||||||||||||||||||||||||||||||||||||||||||||||||||||||||||||||||||||||||||||||||||||||||||||||||||||||||||||||||||||||||||||||||||||||||||||
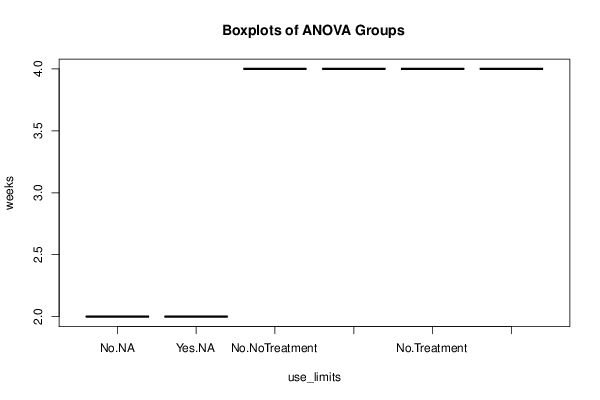
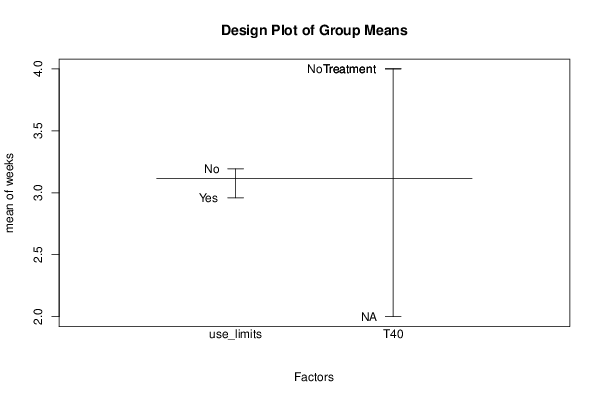
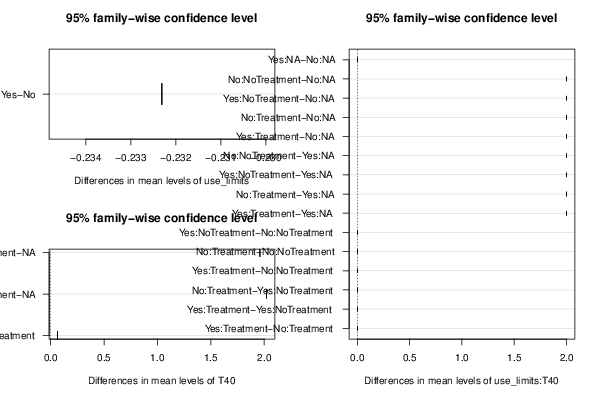
Figures (Output of Computation) | |||||||||||||||||||||||||||||||||||||||||||||||||||||||||||||||||||||||||||||||||||||||||||||||||||||||||||||||||||||||||||||||||||||||||||||||||||||||||||||||||||||||||||||||||||||||||||||||||||||||||||||||||||||||||||||||||||||||||||||||||||||||||||||||||||||||||||||||||||||||||||||||||||||||||||||||||||||||||||||||||||||||||||||||||||||||||||||||||||||||||||||||||||||||||||||||||||||
Input Parameters & R Code | |||||||||||||||||||||||||||||||||||||||||||||||||||||||||||||||||||||||||||||||||||||||||||||||||||||||||||||||||||||||||||||||||||||||||||||||||||||||||||||||||||||||||||||||||||||||||||||||||||||||||||||||||||||||||||||||||||||||||||||||||||||||||||||||||||||||||||||||||||||||||||||||||||||||||||||||||||||||||||||||||||||||||||||||||||||||||||||||||||||||||||||||||||||||||||||||||||||
| Parameters (Session): | |||||||||||||||||||||||||||||||||||||||||||||||||||||||||||||||||||||||||||||||||||||||||||||||||||||||||||||||||||||||||||||||||||||||||||||||||||||||||||||||||||||||||||||||||||||||||||||||||||||||||||||||||||||||||||||||||||||||||||||||||||||||||||||||||||||||||||||||||||||||||||||||||||||||||||||||||||||||||||||||||||||||||||||||||||||||||||||||||||||||||||||||||||||||||||||||||||||
| par2 = grey ; par3 = FALSE ; par4 = Unknown ; | |||||||||||||||||||||||||||||||||||||||||||||||||||||||||||||||||||||||||||||||||||||||||||||||||||||||||||||||||||||||||||||||||||||||||||||||||||||||||||||||||||||||||||||||||||||||||||||||||||||||||||||||||||||||||||||||||||||||||||||||||||||||||||||||||||||||||||||||||||||||||||||||||||||||||||||||||||||||||||||||||||||||||||||||||||||||||||||||||||||||||||||||||||||||||||||||||||||
| Parameters (R input): | |||||||||||||||||||||||||||||||||||||||||||||||||||||||||||||||||||||||||||||||||||||||||||||||||||||||||||||||||||||||||||||||||||||||||||||||||||||||||||||||||||||||||||||||||||||||||||||||||||||||||||||||||||||||||||||||||||||||||||||||||||||||||||||||||||||||||||||||||||||||||||||||||||||||||||||||||||||||||||||||||||||||||||||||||||||||||||||||||||||||||||||||||||||||||||||||||||||
| par1 = 1 ; par2 = 2 ; par3 = 3 ; par4 = TRUE ; | |||||||||||||||||||||||||||||||||||||||||||||||||||||||||||||||||||||||||||||||||||||||||||||||||||||||||||||||||||||||||||||||||||||||||||||||||||||||||||||||||||||||||||||||||||||||||||||||||||||||||||||||||||||||||||||||||||||||||||||||||||||||||||||||||||||||||||||||||||||||||||||||||||||||||||||||||||||||||||||||||||||||||||||||||||||||||||||||||||||||||||||||||||||||||||||||||||||
| R code (references can be found in the software module): | |||||||||||||||||||||||||||||||||||||||||||||||||||||||||||||||||||||||||||||||||||||||||||||||||||||||||||||||||||||||||||||||||||||||||||||||||||||||||||||||||||||||||||||||||||||||||||||||||||||||||||||||||||||||||||||||||||||||||||||||||||||||||||||||||||||||||||||||||||||||||||||||||||||||||||||||||||||||||||||||||||||||||||||||||||||||||||||||||||||||||||||||||||||||||||||||||||||
cat1 <- as.numeric(par1) # | |||||||||||||||||||||||||||||||||||||||||||||||||||||||||||||||||||||||||||||||||||||||||||||||||||||||||||||||||||||||||||||||||||||||||||||||||||||||||||||||||||||||||||||||||||||||||||||||||||||||||||||||||||||||||||||||||||||||||||||||||||||||||||||||||||||||||||||||||||||||||||||||||||||||||||||||||||||||||||||||||||||||||||||||||||||||||||||||||||||||||||||||||||||||||||||||||||||