| Tabulation of Results | ||
| Pre x post1 | ||
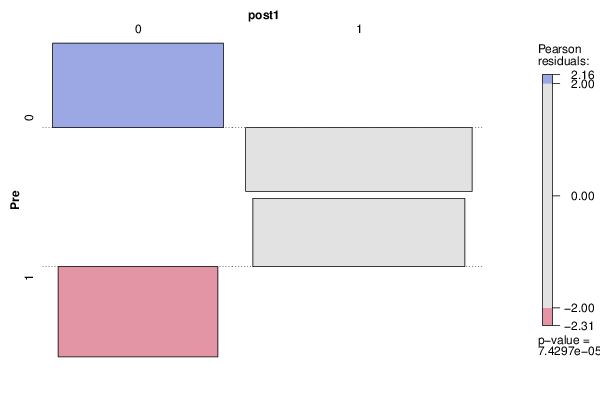
| 0 | 1 | 0 | 30 | 26 | 1 | 8 | 41 |
| Tabulation of Expected Results | ||
| Pre x post1 | ||
| 0 | 1 | 0 | 20.27 | 35.73 | 1 | 17.73 | 31.27 |
| Statistical Results | |
| Pearson's Chi-squared test with Yates' continuity correction | |
| Pearson Chi Square Statistic | 14.13 |
| Degrees of Freedom | 1 |
| P value | 0 |