| Multiple Linear Regression - Estimated Regression Equation |
| units[t] = -4099.40226645732 + 19.1857493382761store[t] + 2562.97249727806promo[t] + 3668.33961822363window[t] + e[t] |
| Multiple Linear Regression - Ordinary Least Squares | |||||
| Variable | Parameter | S.D. | T-STAT H0: parameter = 0 | 2-tail p-value | 1-tail p-value |
| (Intercept) | -4099.40226645732 | 1597.65361 | -2.5659 | 0.013155 | 0.006577 |
| store | 19.1857493382761 | 6.337354 | 3.0274 | 0.003803 | 0.001902 |
| promo | 2562.97249727806 | 391.93637 | 6.5393 | 0 | 0 |
| window | 3668.33961822363 | 507.216991 | 7.2323 | 0 | 0 |
| Multiple Linear Regression - Regression Statistics | |
| Multiple R | 0.849974881565275 |
| R-squared | 0.722457299291904 |
| Adjusted R-squared | 0.70674733510088 |
| F-TEST (value) | 45.9872021671871 |
| F-TEST (DF numerator) | 3 |
| F-TEST (DF denominator) | 53 |
| p-value | 8.88178419700125e-15 |
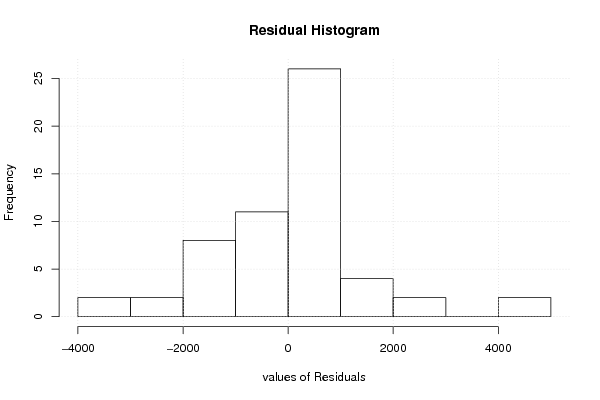
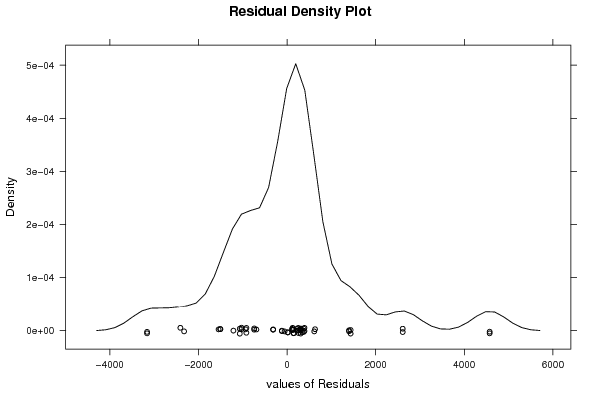
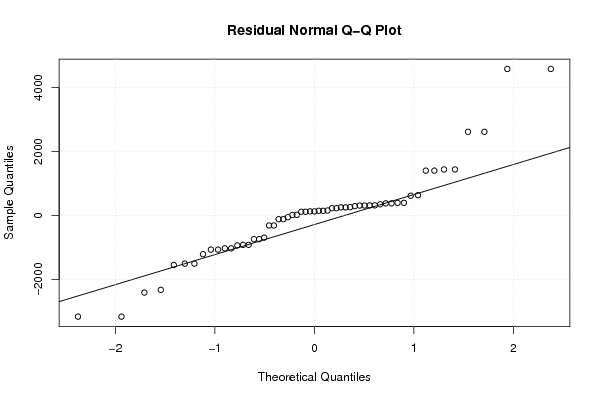
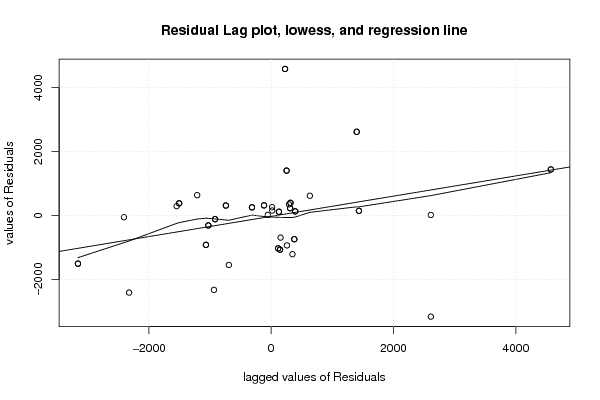
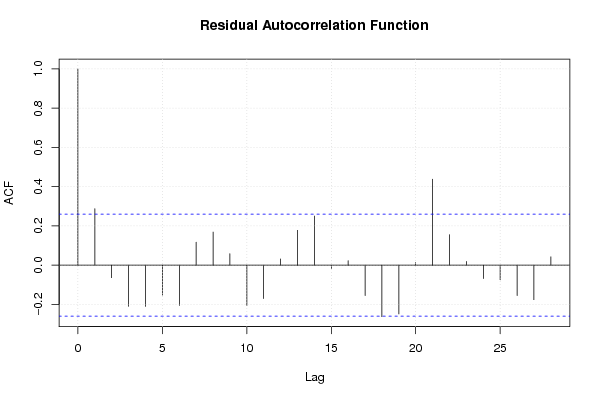
| Multiple Linear Regression - Residual Statistics | |
| Residual Standard Deviation | 1467.83798851293 |
| Sum Squared Residuals | 114191063.107649 |
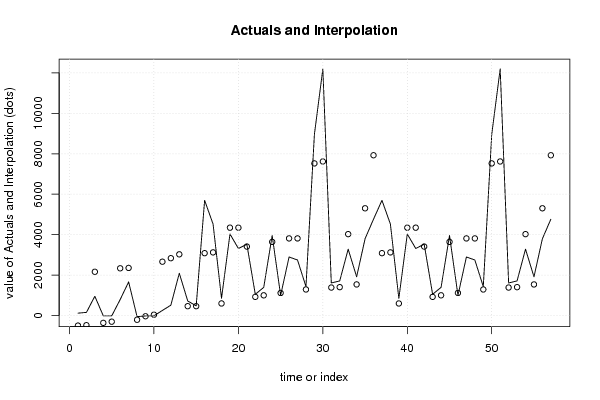
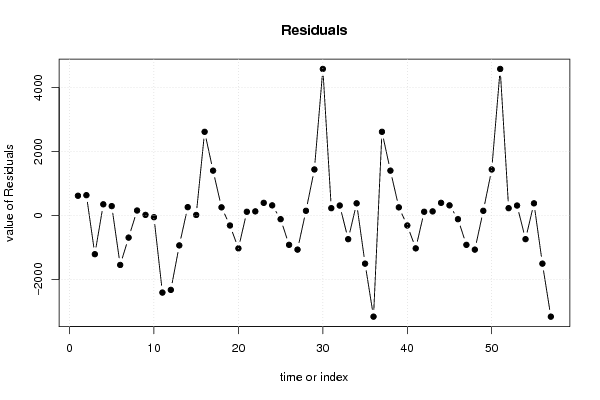
| Multiple Linear Regression - Actuals, Interpolation, and Residuals | |||
| Time or Index | Actuals | Interpolation Forecast | Residuals Prediction Error |
| 1 | 122 | -492.481390861418 | 614.481390861418 |
| 2 | 159 | -473.295641523142 | 632.295641523142 |
| 3 | 956 | 2166.41985310802 | -1210.41985310802 |
| 4 | -11 | -358.181145493485 | 347.181145493485 |
| 5 | -10 | -300.623897478658 | 290.623897478658 |
| 6 | 793 | 2339.0915971525 | -1546.0915971525 |
| 7 | 1666 | 2358.27734649078 | -692.27734649078 |
| 8 | -51 | -204.695150787278 | 153.695150787278 |
| 9 | -15 | -32.023406742793 | 17.023406742793 |
| 10 | -11 | 44.7195906103112 | -55.7195906103112 |
| 11 | 257 | 2665.2493359032 | -2408.2493359032 |
| 12 | 514 | 2837.92107994768 | -2323.92107994768 |
| 13 | 2094 | 3029.77857333044 | -935.778573330443 |
| 14 | 725 | 466.806076052385 | 258.193923947615 |
| 15 | 481 | 466.806076052385 | 14.1939239476147 |
| 16 | 5698 | 3087.33582134527 | 2610.66417865473 |
| 17 | 4524 | 3125.70732002182 | 1398.29267997818 |
| 18 | 853 | 601.106321420318 | 251.893678579682 |
| 19 | 4032 | 4346.18893699706 | -314.188936997056 |
| 20 | 3318 | 4346.18893699706 | -1028.18893699706 |
| 21 | 3528 | 3413.49356009596 | 114.506439904035 |
| 22 | 1054 | 927.264060171011 | 126.735939828989 |
| 23 | 1397 | 1004.00705752412 | 392.992942475884 |
| 24 | 3958 | 3643.72255215528 | 314.277447844722 |
| 25 | 1002 | 1119.12155355377 | -117.121553553772 |
| 26 | 2898 | 3816.39429619976 | -918.394296199763 |
| 27 | 2749 | 3816.39429619976 | -1067.39429619976 |
| 28 | 1436 | 1291.79329759826 | 144.206702401743 |
| 29 | 8958 | 7523.10541309995 | 1434.89458690005 |
| 30 | 12192 | 7619.03415979133 | 4572.96584020867 |
| 31 | 1614 | 1387.72204428964 | 226.277955710363 |
| 32 | 1716 | 1406.90779362791 | 309.092206372087 |
| 33 | 3286 | 4027.4375389208 | -741.437538920799 |
| 34 | 1919 | 1541.20803899585 | 377.791961004154 |
| 35 | 3800 | 5305.47640391086 | -1505.47640391086 |
| 36 | 4766 | 7926.00614920375 | -3160.00614920375 |
| 37 | 5698 | 3087.33582134527 | 2610.66417865473 |
| 38 | 4524 | 3125.70732002182 | 1398.29267997818 |
| 39 | 853 | 601.106321420318 | 251.893678579682 |
| 40 | 4032 | 4346.18893699706 | -314.188936997056 |
| 41 | 3318 | 4346.18893699706 | -1028.18893699706 |
| 42 | 3528 | 3413.49356009596 | 114.506439904035 |
| 43 | 1054 | 927.264060171011 | 126.735939828989 |
| 44 | 1397 | 1004.00705752412 | 392.992942475884 |
| 45 | 3958 | 3643.72255215528 | 314.277447844722 |
| 46 | 1002 | 1119.12155355377 | -117.121553553772 |
| 47 | 2898 | 3816.39429619976 | -918.394296199763 |
| 48 | 2749 | 3816.39429619976 | -1067.39429619976 |
| 49 | 1436 | 1291.79329759826 | 144.206702401743 |
| 50 | 8958 | 7523.10541309995 | 1434.89458690005 |
| 51 | 12192 | 7619.03415979133 | 4572.96584020867 |
| 52 | 1614 | 1387.72204428964 | 226.277955710363 |
| 53 | 1716 | 1406.90779362791 | 309.092206372087 |
| 54 | 3286 | 4027.4375389208 | -741.437538920799 |
| 55 | 1919 | 1541.20803899585 | 377.791961004154 |
| 56 | 3800 | 5305.47640391086 | -1505.47640391086 |
| 57 | 4766 | 7926.00614920375 | -3160.00614920375 |
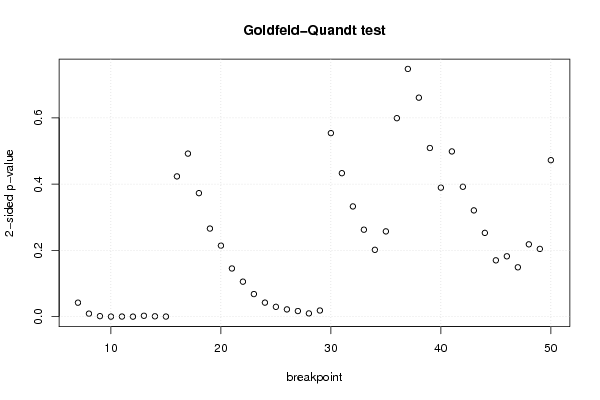
| Goldfeld-Quandt test for Heteroskedasticity | |||
| p-values | Alternative Hypothesis | ||
| breakpoint index | greater | 2-sided | less |
| 7 | 0.0211638939560962 | 0.0423277879121924 | 0.978836106043904 |
| 8 | 0.00458158337543309 | 0.00916316675086618 | 0.995418416624567 |
| 9 | 0.000845728809379675 | 0.00169145761875935 | 0.99915427119062 |
| 10 | 0.000141595143028089 | 0.000283190286056177 | 0.999858404856972 |
| 11 | 0.000223350188235159 | 0.000446700376470318 | 0.999776649811765 |
| 12 | 7.03439827901713e-05 | 0.000140687965580343 | 0.99992965601721 |
| 13 | 0.00140202575120976 | 0.00280405150241951 | 0.99859797424879 |
| 14 | 0.000617110798490027 | 0.00123422159698005 | 0.99938288920151 |
| 15 | 0.000201692826380083 | 0.000403385652760165 | 0.99979830717362 |
| 16 | 0.211781625151483 | 0.423563250302966 | 0.788218374848517 |
| 17 | 0.246163917400189 | 0.492327834800377 | 0.753836082599811 |
| 18 | 0.18652481839116 | 0.37304963678232 | 0.81347518160884 |
| 19 | 0.13303126591683 | 0.266062531833661 | 0.86696873408317 |
| 20 | 0.107258532268044 | 0.214517064536088 | 0.892741467731956 |
| 21 | 0.0727810935180333 | 0.145562187036067 | 0.927218906481967 |
| 22 | 0.0528911403637164 | 0.105782280727433 | 0.947108859636284 |
| 23 | 0.0341766691078935 | 0.0683533382157871 | 0.965823330892106 |
| 24 | 0.0212346663218429 | 0.0424693326436858 | 0.978765333678157 |
| 25 | 0.0148758746028066 | 0.0297517492056133 | 0.985124125397193 |
| 26 | 0.0110256789726528 | 0.0220513579453056 | 0.988974321027347 |
| 27 | 0.00855736021601688 | 0.0171147204320338 | 0.991442639783983 |
| 28 | 0.00492230435809841 | 0.00984460871619681 | 0.995077695641902 |
| 29 | 0.00935460694906371 | 0.0187092138981274 | 0.990645393050936 |
| 30 | 0.277134294920936 | 0.554268589841872 | 0.722865705079064 |
| 31 | 0.216611191235974 | 0.433222382471947 | 0.783388808764026 |
| 32 | 0.166437291912217 | 0.332874583824434 | 0.833562708087783 |
| 33 | 0.131312065272659 | 0.262624130545319 | 0.868687934727341 |
| 34 | 0.100958109932239 | 0.201916219864478 | 0.899041890067761 |
| 35 | 0.128776125656936 | 0.257552251313873 | 0.871223874343064 |
| 36 | 0.299635053834096 | 0.599270107668191 | 0.700364946165904 |
| 37 | 0.373960725986942 | 0.747921451973884 | 0.626039274013058 |
| 38 | 0.330616377237129 | 0.661232754474259 | 0.669383622762871 |
| 39 | 0.254630596227474 | 0.509261192454948 | 0.745369403772526 |
| 40 | 0.194795832915357 | 0.389591665830714 | 0.805204167084643 |
| 41 | 0.249471595263154 | 0.498943190526308 | 0.750528404736846 |
| 42 | 0.196131768722942 | 0.392263537445885 | 0.803868231277058 |
| 43 | 0.16046002393302 | 0.32092004786604 | 0.83953997606698 |
| 44 | 0.126522365446 | 0.253044730892001 | 0.873477634554 |
| 45 | 0.0851110412036034 | 0.170222082407207 | 0.914888958796397 |
| 46 | 0.0911974220206705 | 0.182394844041341 | 0.90880257797933 |
| 47 | 0.0745968581608568 | 0.149193716321714 | 0.925403141839143 |
| 48 | 0.109220128191026 | 0.218440256382053 | 0.890779871808974 |
| 49 | 0.102311810962284 | 0.204623621924567 | 0.897688189037716 |
| 50 | 0.236259035224274 | 0.472518070448548 | 0.763740964775726 |
| Meta Analysis of Goldfeld-Quandt test for Heteroskedasticity | |||
| Description | # significant tests | % significant tests | OK/NOK |
| 1% type I error level | 9 | 0.204545454545455 | NOK |
| 5% type I error level | 15 | 0.340909090909091 | NOK |
| 10% type I error level | 16 | 0.363636363636364 | NOK |