| Multiple Linear Regression - Estimated Regression Equation |
| Connected[t] = + 10.9758440334628 + 0.434969804573434Separate[t] + 0.137588630034852Learning[t] -0.00275390329343048Software[t] + 0.116676408047773Happiness[t] -0.0335936849979727Depression[t] + 0.199184622033619Belonging[t] -0.207011125616048Belonging_Final[t] + e[t] |
| Multiple Linear Regression - Ordinary Least Squares | |||||
| Variable | Parameter | S.D. | T-STAT H0: parameter = 0 | 2-tail p-value | 1-tail p-value |
| (Intercept) | 10.9758440334628 | 11.937658 | 0.9194 | 0.36475 | 0.182375 |
| Separate | 0.434969804573434 | 0.153055 | 2.8419 | 0.007742 | 0.003871 |
| Learning | 0.137588630034852 | 0.277041 | 0.4966 | 0.62284 | 0.31142 |
| Software | -0.00275390329343048 | 0.259035 | -0.0106 | 0.991584 | 0.495792 |
| Happiness | 0.116676408047773 | 0.345407 | 0.3378 | 0.737724 | 0.368862 |
| Depression | -0.0335936849979727 | 0.254622 | -0.1319 | 0.895861 | 0.447931 |
| Belonging | 0.199184622033619 | 0.236953 | 0.8406 | 0.406804 | 0.203402 |
| Belonging_Final | -0.207011125616048 | 0.386635 | -0.5354 | 0.596063 | 0.298031 |
| Multiple Linear Regression - Regression Statistics | |
| Multiple R | 0.586414070248329 |
| R-squared | 0.343881461785212 |
| Adjusted R-squared | 0.200355531550727 |
| F-TEST (value) | 2.39595354806896 |
| F-TEST (DF numerator) | 7 |
| F-TEST (DF denominator) | 32 |
| p-value | 0.0432899539913394 |
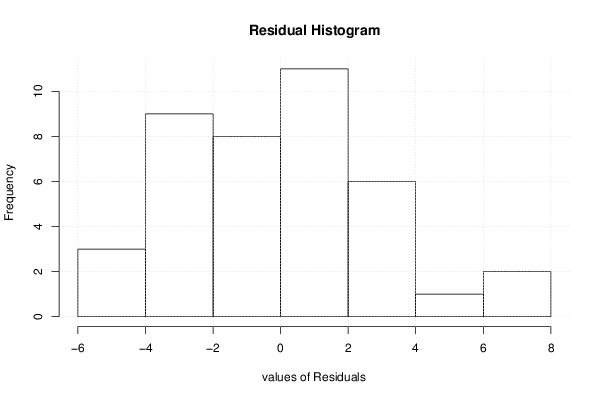
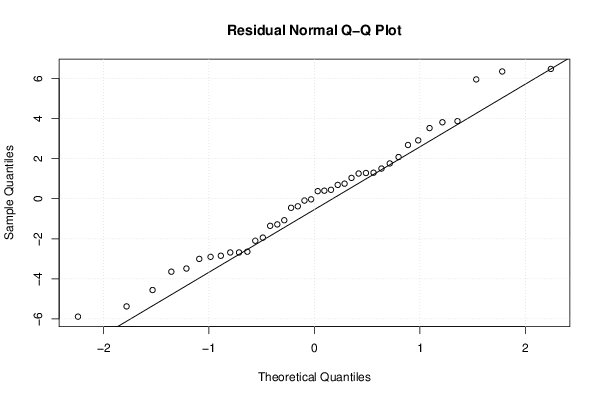
| Multiple Linear Regression - Residual Statistics | |
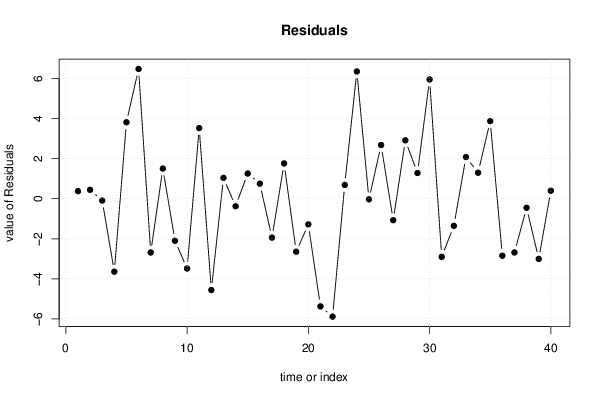
| Residual Standard Deviation | 3.36423019191688 |
| Sum Squared Residuals | 362.177433094563 |
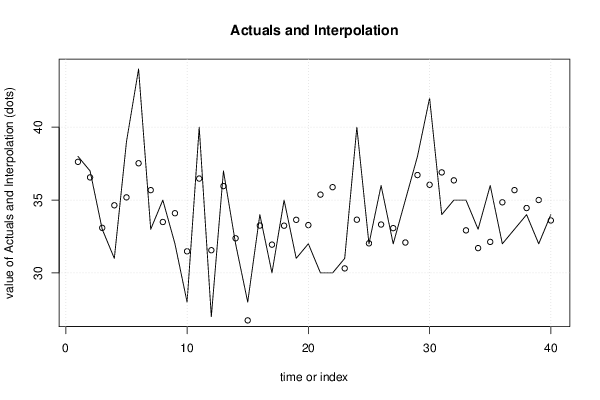
| Multiple Linear Regression - Actuals, Interpolation, and Residuals | |||
| Time or Index | Actuals | Interpolation Forecast | Residuals Prediction Error |
| 1 | 38 | 37.624717926223 | 0.375282073776949 |
| 2 | 37 | 36.5574650530365 | 0.442534946963499 |
| 3 | 33 | 33.0935290244184 | -0.0935290244183628 |
| 4 | 31 | 34.6432821218873 | -3.64328212188729 |
| 5 | 39 | 35.1869217283726 | 3.8130782716274 |
| 6 | 44 | 37.5271147764056 | 6.47288522359442 |
| 7 | 33 | 35.6834872639909 | -2.68348726399092 |
| 8 | 35 | 33.496849683634 | 1.50315031636598 |
| 9 | 32 | 34.0986302901657 | -2.09863029016573 |
| 10 | 28 | 31.4844251459809 | -3.48442514598091 |
| 11 | 40 | 36.4780270458774 | 3.52197295412263 |
| 12 | 27 | 31.5585050481466 | -4.55850504814663 |
| 13 | 37 | 35.9620627411106 | 1.03793725888942 |
| 14 | 32 | 32.378811264993 | -0.378811264992972 |
| 15 | 28 | 26.7444349729485 | 1.25556502705148 |
| 16 | 34 | 33.2506457427692 | 0.74935425723078 |
| 17 | 30 | 31.9422448127937 | -1.94224481279374 |
| 18 | 35 | 33.2418360942789 | 1.75816390572107 |
| 19 | 31 | 33.6456629588781 | -2.64566295887805 |
| 20 | 32 | 33.2830159583925 | -1.28301595839245 |
| 21 | 30 | 35.3743134930398 | -5.37431349303976 |
| 22 | 30 | 35.8861186846579 | -5.88611868465786 |
| 23 | 31 | 30.3130007019731 | 0.686999298026937 |
| 24 | 40 | 33.6528744951365 | 6.34712550486354 |
| 25 | 32 | 32.0330300341477 | -0.0330300341477463 |
| 26 | 36 | 33.3217394811975 | 2.67826051880249 |
| 27 | 32 | 33.0752004520545 | -1.07520045205452 |
| 28 | 35 | 32.0885181282093 | 2.91148187179065 |
| 29 | 38 | 36.719076913117 | 1.280923086883 |
| 30 | 42 | 36.0495184067452 | 5.9504815932548 |
| 31 | 34 | 36.9004609360816 | -2.90046093608164 |
| 32 | 35 | 36.3543570085358 | -1.35435700853583 |
| 33 | 35 | 32.9230951593982 | 2.07690484060184 |
| 34 | 33 | 31.7047031361017 | 1.29529686389829 |
| 35 | 36 | 32.130066415141 | 3.86993358485899 |
| 36 | 32 | 34.8472742148992 | -2.8472742148992 |
| 37 | 33 | 35.6834872639909 | -2.68348726399092 |
| 38 | 34 | 34.4543939081874 | -0.454393908187432 |
| 39 | 32 | 35.0052020642351 | -3.00520206423514 |
| 40 | 34 | 33.601899448847 | 0.398100551152953 |
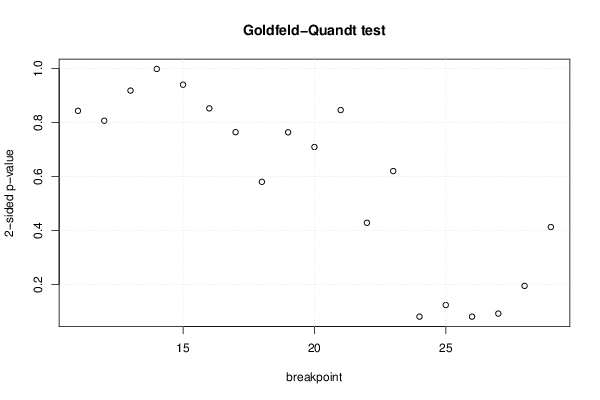
| Goldfeld-Quandt test for Heteroskedasticity | |||
| p-values | Alternative Hypothesis | ||
| breakpoint index | greater | 2-sided | less |
| 11 | 0.421470511443275 | 0.84294102288655 | 0.578529488556725 |
| 12 | 0.596840317217665 | 0.80631936556467 | 0.403159682782335 |
| 13 | 0.45902590523047 | 0.918051810460941 | 0.54097409476953 |
| 14 | 0.500905564178939 | 0.998188871642122 | 0.499094435821061 |
| 15 | 0.469876208601066 | 0.939752417202132 | 0.530123791398934 |
| 16 | 0.426055591512038 | 0.852111183024076 | 0.573944408487962 |
| 17 | 0.381945323955714 | 0.763890647911427 | 0.618054676044286 |
| 18 | 0.290006760282232 | 0.580013520564464 | 0.709993239717768 |
| 19 | 0.381706974636715 | 0.76341394927343 | 0.618293025363285 |
| 20 | 0.354528414045071 | 0.709056828090142 | 0.645471585954929 |
| 21 | 0.576983037116297 | 0.846033925767406 | 0.423016962883703 |
| 22 | 0.785903953103134 | 0.428192093793733 | 0.214096046896866 |
| 23 | 0.690104269726099 | 0.619791460547803 | 0.309895730273901 |
| 24 | 0.959761657054298 | 0.0804766858914034 | 0.0402383429457017 |
| 25 | 0.938299320542343 | 0.123401358915315 | 0.0617006794576574 |
| 26 | 0.959771830874699 | 0.0804563382506021 | 0.040228169125301 |
| 27 | 0.954077065289759 | 0.0918458694204813 | 0.0459229347102407 |
| 28 | 0.902768671721516 | 0.194462656556969 | 0.0972313282784843 |
| 29 | 0.793720140882943 | 0.412559718234115 | 0.206279859117058 |
| Meta Analysis of Goldfeld-Quandt test for Heteroskedasticity | |||
| Description | # significant tests | % significant tests | OK/NOK |
| 1% type I error level | 0 | 0 | OK |
| 5% type I error level | 0 | 0 | OK |
| 10% type I error level | 3 | 0.157894736842105 | NOK |