| Multiple Linear Regression - Estimated Regression Equation |
| Points[t] = + 4.14870670628904 -3.69049908336127Height[t] + 0.00945845788151719Weight[t] + 47.9401991647774Fieldgoals[t] + 11.3710192606295Freethrows[t] + e[t] |
| Multiple Linear Regression - Ordinary Least Squares | |||||
| Variable | Parameter | S.D. | T-STAT H0: parameter = 0 | 2-tail p-value | 1-tail p-value |
| (Intercept) | 4.14870670628904 | 14.855006 | 0.2793 | 0.781205 | 0.390603 |
| Height | -3.69049908336127 | 2.97078 | -1.2423 | 0.220051 | 0.110026 |
| Weight | 0.00945845788151719 | 0.046297 | 0.2043 | 0.838966 | 0.419483 |
| Fieldgoals | 47.9401991647774 | 15.709131 | 3.0517 | 0.003668 | 0.001834 |
| Freethrows | 11.3710192606295 | 7.868536 | 1.4451 | 0.154788 | 0.077394 |
| Multiple Linear Regression - Regression Statistics | |
| Multiple R | 0.471434652205528 |
| R-squared | 0.222250631300147 |
| Adjusted R-squared | 0.158760886916485 |
| F-TEST (value) | 3.50057530484154 |
| F-TEST (DF numerator) | 4 |
| F-TEST (DF denominator) | 49 |
| p-value | 0.0136396816766932 |
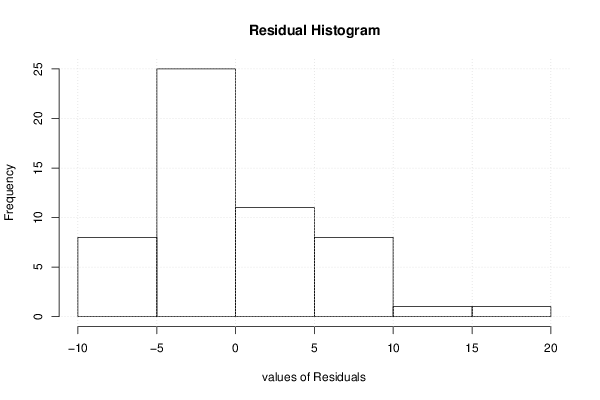
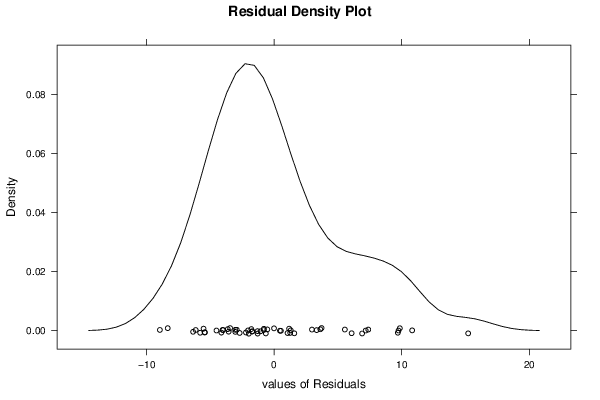
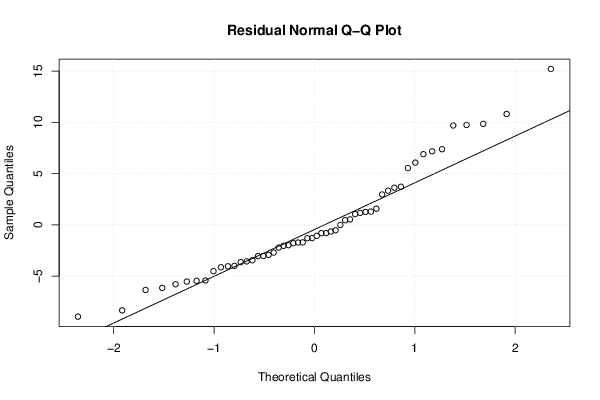
| Multiple Linear Regression - Residual Statistics | |
| Residual Standard Deviation | 5.41074474747539 |
| Sum Squared Residuals | 1434.5317773943 |
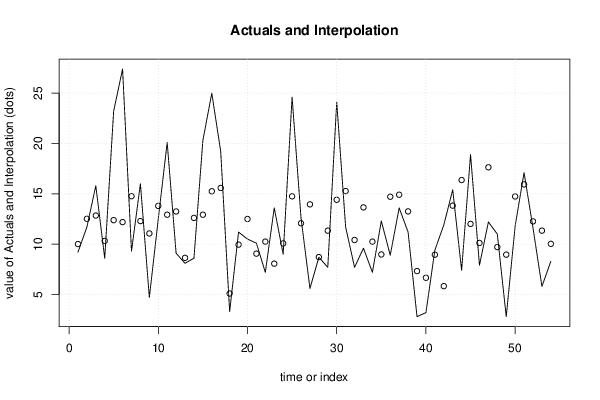
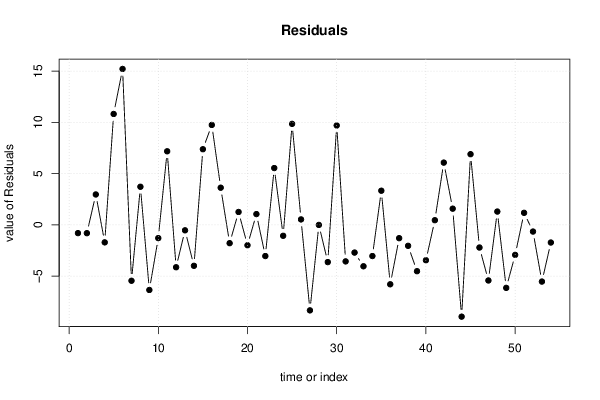
| Multiple Linear Regression - Actuals, Interpolation, and Residuals | |||
| Time or Index | Actuals | Interpolation Forecast | Residuals Prediction Error |
| 1 | 9.2 | 10.0123589367484 | -0.812358936748392 |
| 2 | 11.7 | 12.517773887186 | -0.817773887185997 |
| 3 | 15.8 | 12.8406960467427 | 2.9593039532573 |
| 4 | 8.6 | 10.3157911993394 | -1.71579119933944 |
| 5 | 23.2 | 12.3823136563589 | 10.8176863436411 |
| 6 | 27.4 | 12.1892864594283 | 15.2107135405717 |
| 7 | 9.3 | 14.7623100323856 | -5.46231003238564 |
| 8 | 16 | 12.2882683953416 | 3.71173160465835 |
| 9 | 4.7 | 11.0624810251259 | -6.36248102512589 |
| 10 | 12.5 | 13.8010254919996 | -1.30102549199961 |
| 11 | 20.1 | 12.925212153811 | 7.17478784618905 |
| 12 | 9.1 | 13.2439649805998 | -4.14396498059976 |
| 13 | 8.1 | 8.64006433260676 | -0.540064332606764 |
| 14 | 8.6 | 12.6052585135438 | -4.00525851354384 |
| 15 | 20.3 | 12.9243025667769 | 7.37569743322306 |
| 16 | 25 | 15.2545908026032 | 9.74540919739684 |
| 17 | 19.2 | 15.5813827174425 | 3.61861728255749 |
| 18 | 3.3 | 5.09650333893457 | -1.79650333893457 |
| 19 | 11.2 | 9.94940424303772 | 1.25059575696228 |
| 20 | 10.5 | 12.4969612371254 | -1.9969612371254 |
| 21 | 10.1 | 9.05637536306628 | 1.04362463693372 |
| 22 | 7.2 | 10.2508314337258 | -3.0508314337258 |
| 23 | 13.6 | 8.06191203075837 | 5.53808796924163 |
| 24 | 9 | 10.0725578058519 | -1.07255780585193 |
| 25 | 24.6 | 14.7496348388613 | 9.85036516113873 |
| 26 | 12.6 | 12.0761089822285 | 0.523891017771477 |
| 27 | 5.6 | 13.9530028667991 | -8.35300286679914 |
| 28 | 8.7 | 8.71473239239671 | -0.0147323923967117 |
| 29 | 7.7 | 11.3419041026698 | -3.64190410266982 |
| 30 | 24.1 | 14.4070745470549 | 9.69292545294513 |
| 31 | 11.7 | 15.2728312600118 | -3.57283126001183 |
| 32 | 7.7 | 10.4123042990696 | -2.71230429906963 |
| 33 | 9.6 | 13.6499130748098 | -4.04991307480981 |
| 34 | 7.2 | 10.2508314337258 | -3.0508314337258 |
| 35 | 12.3 | 8.9744592454595 | 3.3255407545405 |
| 36 | 8.9 | 14.7076375300961 | -5.80763753009605 |
| 37 | 13.6 | 14.9072656256573 | -1.30726562565732 |
| 38 | 11.2 | 13.2531659986165 | -2.05316599861648 |
| 39 | 2.8 | 7.32888666064327 | -4.52888666064327 |
| 40 | 3.2 | 6.65979040013695 | -3.45979040013695 |
| 41 | 9.4 | 8.95334040628063 | 0.446659593719372 |
| 42 | 11.9 | 5.83073166030797 | 6.06926833969203 |
| 43 | 15.4 | 13.8267528762838 | 1.57324712371624 |
| 44 | 7.4 | 16.3662783858909 | -8.96627838589092 |
| 45 | 18.9 | 12.0092846539182 | 6.89071534608183 |
| 46 | 7.9 | 10.1187168518401 | -2.21871685184007 |
| 47 | 12.2 | 17.6347150913581 | -5.43471509135815 |
| 48 | 11 | 9.70871124691338 | 1.29128875308661 |
| 49 | 2.8 | 8.95738083438331 | -6.15738083438331 |
| 50 | 11.8 | 14.7364478817661 | -2.93644788176607 |
| 51 | 17.1 | 15.9327594135102 | 1.16724058648976 |
| 52 | 11.6 | 12.2597264618977 | -0.65972646189774 |
| 53 | 5.8 | 11.3418805395639 | -5.54188053956391 |
| 54 | 8.3 | 10.0321037873082 | -1.73210378730819 |
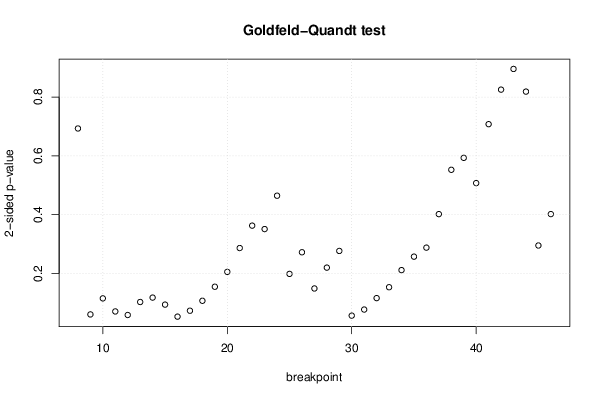
| Goldfeld-Quandt test for Heteroskedasticity | |||
| p-values | Alternative Hypothesis | ||
| breakpoint index | greater | 2-sided | less |
| 8 | 0.346674464959305 | 0.69334892991861 | 0.653325535040695 |
| 9 | 0.969673504895931 | 0.0606529902081386 | 0.0303264951040693 |
| 10 | 0.942389318935102 | 0.115221362129795 | 0.0576106810648975 |
| 11 | 0.964604553136096 | 0.0707908937278073 | 0.0353954468639036 |
| 12 | 0.970641444157544 | 0.0587171116849112 | 0.0293585558424556 |
| 13 | 0.948552194291449 | 0.102895611417102 | 0.051447805708551 |
| 14 | 0.941052830651116 | 0.117894338697768 | 0.058947169348884 |
| 15 | 0.952979873180513 | 0.094040253638973 | 0.0470201268194865 |
| 16 | 0.973474302795041 | 0.0530513944099186 | 0.0265256972049593 |
| 17 | 0.96339859723598 | 0.0732028055280407 | 0.0366014027640203 |
| 18 | 0.946451139553082 | 0.107097720893836 | 0.053548860446918 |
| 19 | 0.922584048057447 | 0.154831903885107 | 0.0774159519425535 |
| 20 | 0.897298724406581 | 0.205402551186839 | 0.102701275593419 |
| 21 | 0.856730843178703 | 0.286538313642595 | 0.143269156821297 |
| 22 | 0.818635568456793 | 0.362728863086414 | 0.181364431543207 |
| 23 | 0.824505313175872 | 0.350989373648256 | 0.175494686824128 |
| 24 | 0.767723788011038 | 0.464552423977923 | 0.232276211988962 |
| 25 | 0.900757090646285 | 0.19848581870743 | 0.0992429093537148 |
| 26 | 0.86391241091739 | 0.27217517816522 | 0.13608758908261 |
| 27 | 0.925550758981867 | 0.148898482036266 | 0.0744492410181328 |
| 28 | 0.890077789197883 | 0.219844421604233 | 0.109922210802116 |
| 29 | 0.861679328635604 | 0.276641342728792 | 0.138320671364396 |
| 30 | 0.971737008861826 | 0.0565259822763485 | 0.0282629911381742 |
| 31 | 0.961387112262467 | 0.0772257754750663 | 0.0386128877375331 |
| 32 | 0.941960830772221 | 0.116078338455558 | 0.0580391692277791 |
| 33 | 0.923401535581714 | 0.153196928836571 | 0.0765984644182856 |
| 34 | 0.894314457372777 | 0.211371085254447 | 0.105685542627223 |
| 35 | 0.871385497752883 | 0.257229004494234 | 0.128614502247117 |
| 36 | 0.856070118817188 | 0.287859762365625 | 0.143929881182812 |
| 37 | 0.799030921439965 | 0.40193815712007 | 0.200969078560035 |
| 38 | 0.723613024773335 | 0.552773950453329 | 0.276386975226665 |
| 39 | 0.703299313295791 | 0.593401373408419 | 0.296700686704209 |
| 40 | 0.746249325058182 | 0.507501349883636 | 0.253750674941818 |
| 41 | 0.646007856458894 | 0.707984287082212 | 0.353992143541106 |
| 42 | 0.587250846705032 | 0.825498306589937 | 0.412749153294968 |
| 43 | 0.552039181015054 | 0.895921637969893 | 0.447960818984946 |
| 44 | 0.590576561345489 | 0.818846877309022 | 0.409423438654511 |
| 45 | 0.852416582232541 | 0.295166835534918 | 0.147583417767459 |
| 46 | 0.798975727934988 | 0.402048544130023 | 0.201024272065012 |
| Meta Analysis of Goldfeld-Quandt test for Heteroskedasticity | |||
| Description | # significant tests | % significant tests | OK/NOK |
| 1% type I error level | 0 | 0 | OK |
| 5% type I error level | 0 | 0 | OK |
| 10% type I error level | 8 | 0.205128205128205 | NOK |