| Tabulation of Results | ||||
| Connected x Depression | ||||
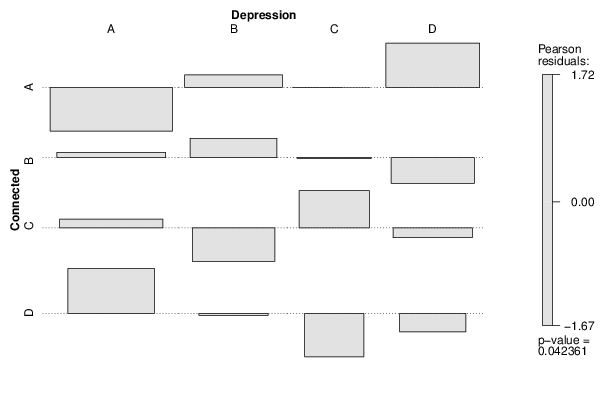
| A | B | C | D | A | 12 | 14 | 9 | 17 | B | 16 | 12 | 7 | 6 | C | 15 | 5 | 10 | 7 | D | 15 | 6 | 1 | 4 |
| Tabulation of Expected Results | ||||
| Connected x Depression | ||||
| A | B | C | D | A | 19.33 | 12.33 | 9 | 11.33 | B | 15.24 | 9.72 | 7.1 | 8.94 | C | 13.76 | 8.78 | 6.4 | 8.06 | D | 9.67 | 6.17 | 4.5 | 5.67 |
| Statistical Results | |
| Pearson's Chi-squared test | |
| Pearson Chi Square Statistic | 17.43 |
| Degrees of Freedom | 9 |
| P value | 0.04 |