| Tabulation of Results | ||||
| Depression x Connected | ||||
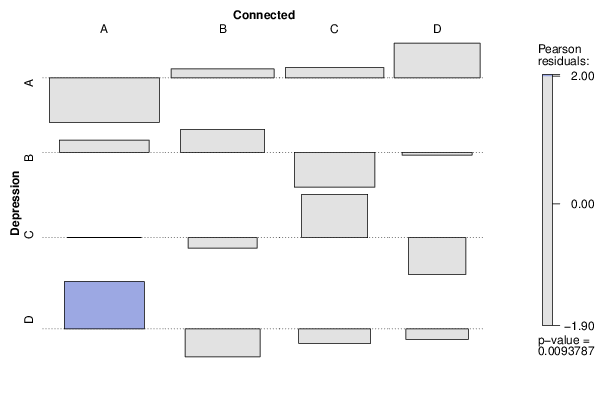
| A | B | C | D | A | 8 | 15 | 14 | 14 | B | 12 | 12 | 4 | 6 | C | 7 | 5 | 10 | 1 | D | 14 | 4 | 5 | 4 |
| Tabulation of Expected Results | ||||
| Depression x Connected | ||||
| A | B | C | D | A | 15.49 | 13.6 | 12.47 | 9.44 | B | 10.33 | 9.07 | 8.31 | 6.3 | C | 6.99 | 6.13 | 5.62 | 4.26 | D | 8.2 | 7.2 | 6.6 | 5 |
| Statistical Results | |
| Pearson's Chi-squared test | |
| Pearson Chi Square Statistic | 21.85 |
| Degrees of Freedom | 9 |
| P value | 0.01 |