| Tabulation of Results | ||
| Software x Happiness | ||
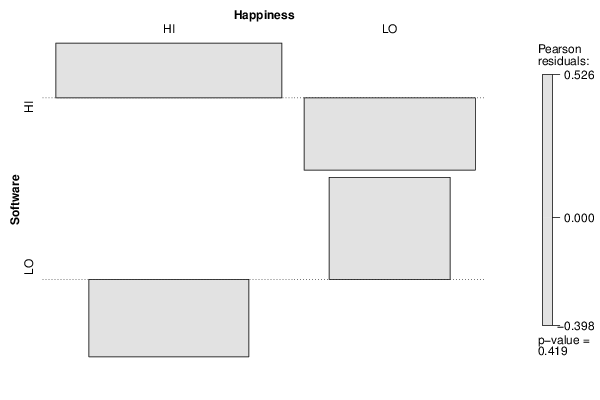
| HI | LO | HI | 71 | 37 | LO | 32 | 22 |
| Tabulation of Expected Results | ||
| Software x Happiness | ||
| HI | LO | HI | 68.67 | 39.33 | LO | 34.33 | 19.67 |
| Statistical Results | |
| Pearson's Chi-squared test with Yates' continuity correction | |
| Pearson Chi Square Statistic | 0.4 |
| Degrees of Freedom | 1 |
| P value | 0.53 |