Free Statistics
of Irreproducible Research!
Description of Statistical Computation | |||||||||||||||||||||||||||||||||||||||||
|---|---|---|---|---|---|---|---|---|---|---|---|---|---|---|---|---|---|---|---|---|---|---|---|---|---|---|---|---|---|---|---|---|---|---|---|---|---|---|---|---|---|
| Author's title | |||||||||||||||||||||||||||||||||||||||||
| Author | *The author of this computation has been verified* | ||||||||||||||||||||||||||||||||||||||||
| R Software Module | rwasp_univariatedataseries.wasp | ||||||||||||||||||||||||||||||||||||||||
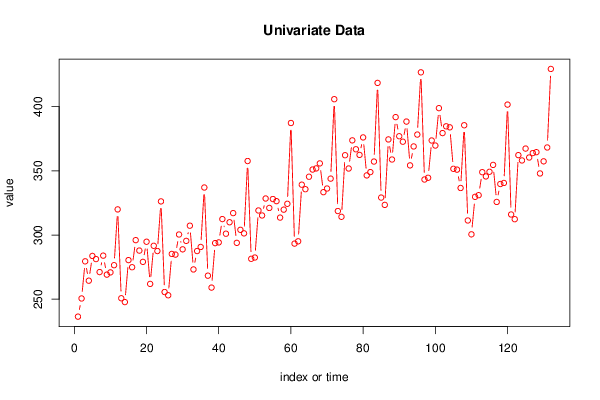
| Title produced by software | Univariate Data Series | ||||||||||||||||||||||||||||||||||||||||
| Date of computation | Sat, 10 Nov 2012 08:33:17 -0500 | ||||||||||||||||||||||||||||||||||||||||
| Cite this page as follows | Statistical Computations at FreeStatistics.org, Office for Research Development and Education, URL https://freestatistics.org/blog/index.php?v=date/2012/Nov/10/t1352554470qgeggbzdggvx2h1.htm/, Retrieved Tue, 23 Apr 2024 14:01:18 +0000 | ||||||||||||||||||||||||||||||||||||||||
| Statistical Computations at FreeStatistics.org, Office for Research Development and Education, URL https://freestatistics.org/blog/index.php?pk=187343, Retrieved Tue, 23 Apr 2024 14:01:18 +0000 | |||||||||||||||||||||||||||||||||||||||||
| QR Codes: | |||||||||||||||||||||||||||||||||||||||||
|
| |||||||||||||||||||||||||||||||||||||||||
| Original text written by user: | |||||||||||||||||||||||||||||||||||||||||
| IsPrivate? | No (this computation is public) | ||||||||||||||||||||||||||||||||||||||||
| User-defined keywords | |||||||||||||||||||||||||||||||||||||||||
| Estimated Impact | 88 | ||||||||||||||||||||||||||||||||||||||||
Tree of Dependent Computations | |||||||||||||||||||||||||||||||||||||||||
| Family? (F = Feedback message, R = changed R code, M = changed R Module, P = changed Parameters, D = changed Data) | |||||||||||||||||||||||||||||||||||||||||
| - [Univariate Data Series] [data set] [2008-12-01 19:54:57] [b98453cac15ba1066b407e146608df68] - RMPD [Univariate Data Series] [timeserie WS8 USA...] [2012-11-10 13:33:17] [c63d55528b56cf8bb48e0b5d1a959d8e] [Current] | |||||||||||||||||||||||||||||||||||||||||
| Feedback Forum | |||||||||||||||||||||||||||||||||||||||||
Post a new message | |||||||||||||||||||||||||||||||||||||||||
Dataset | |||||||||||||||||||||||||||||||||||||||||
| Dataseries X: | |||||||||||||||||||||||||||||||||||||||||
236.422 250.580 279.515 264.417 283.706 281.288 271.146 283.944 269.155 270.899 276.507 319.957 250.746 247.772 280.449 274.925 296.013 287.881 279.098 294.763 261.924 291.596 287.537 326.201 255.598 253.086 285.261 284.747 300.402 288.854 295.433 307.256 273.189 287.540 290.705 337.006 268.335 259.060 293.703 294.262 312.404 301.014 309.942 317.079 293.912 304.060 301.299 357.634 281.493 282.478 319.111 315.223 328.445 321.081 328.040 326.362 313.566 319.768 324.315 387.243 293.308 295.109 339.190 335.678 345.401 351.002 351.889 355.773 333.363 336.214 343.910 405.788 318.682 314.189 362.141 351.811 373.727 366.795 362.393 376.006 346.423 349.007 357.224 418.473 329.169 323.456 374.439 358.806 391.816 376.944 372.665 388.357 354.241 368.982 378.233 426.699 343.241 344.577 373.623 369.688 398.816 379.387 384.666 383.879 351.578 350.920 336.629 385.504 311.330 300.545 329.718 331.023 348.944 345.650 349.260 354.597 325.769 339.734 340.543 401.585 315.998 312.327 362.217 358.067 367.321 360.372 363.830 364.525 347.945 357.404 368.182 429.343 | |||||||||||||||||||||||||||||||||||||||||
Tables (Output of Computation) | |||||||||||||||||||||||||||||||||||||||||
| |||||||||||||||||||||||||||||||||||||||||
Figures (Output of Computation) | |||||||||||||||||||||||||||||||||||||||||
Input Parameters & R Code | |||||||||||||||||||||||||||||||||||||||||
| Parameters (Session): | |||||||||||||||||||||||||||||||||||||||||
| par1 = dvance Monthly Sales for Retail and Food Services ; par2 = www.census.gov ; par3 = aandelijkse verkoopcijfers van 2000-2010 ; par4 = 12 ; | |||||||||||||||||||||||||||||||||||||||||
| Parameters (R input): | |||||||||||||||||||||||||||||||||||||||||
| par1 = dvance Monthly Sales for Retail and Food Services ; par2 = www.census.gov ; par3 = aandelijkse verkoopcijfers van 2000-2010 ; par4 = 12 ; | |||||||||||||||||||||||||||||||||||||||||
| R code (references can be found in the software module): | |||||||||||||||||||||||||||||||||||||||||
bitmap(file='test1.png') | |||||||||||||||||||||||||||||||||||||||||