| Tabulation of Results | ||
| Happiness x Happiness | ||
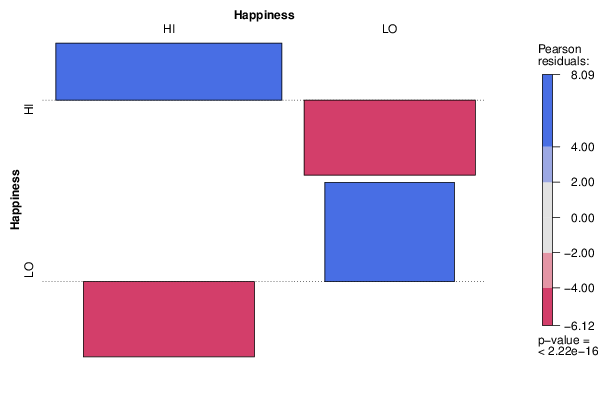
| HI | LO | HI | 103 | 0 | LO | 0 | 59 |
| Tabulation of Expected Results | ||
| Happiness x Happiness | ||
| HI | LO | HI | 65.49 | 37.51 | LO | 37.51 | 21.49 |
| Statistical Results | |
| Pearson's Chi-squared test with Yates' continuity correction | |
| Pearson Chi Square Statistic | 157.71 |
| Degrees of Freedom | 1 |
| P value | 0 |