| Multiple Linear Regression - Estimated Regression Equation |
| Inc[t] = -34.8942759378569 + 0.49528783625183Cons[t] + 0.868235231892937Price[t] + 0.555659857747887t + e[t] |
| Multiple Linear Regression - Ordinary Least Squares | |||||
| Variable | Parameter | S.D. | T-STAT H0: parameter = 0 | 2-tail p-value | 1-tail p-value |
| (Intercept) | -34.8942759378569 | 33.921478 | -1.0287 | 0.322391 | 0.161196 |
| Cons | 0.49528783625183 | 0.125802 | 3.937 | 0.001703 | 0.000851 |
| Price | 0.868235231892937 | 0.232109 | 3.7406 | 0.002471 | 0.001236 |
| t | 0.555659857747887 | 0.561028 | 0.9904 | 0.34004 | 0.17002 |
| Multiple Linear Regression - Regression Statistics | |
| Multiple R | 0.760168409348884 |
| R-squared | 0.577856010572012 |
| Adjusted R-squared | 0.480438166857861 |
| F-TEST (value) | 5.93172655584115 |
| F-TEST (DF numerator) | 3 |
| F-TEST (DF denominator) | 13 |
| p-value | 0.00889256497552537 |
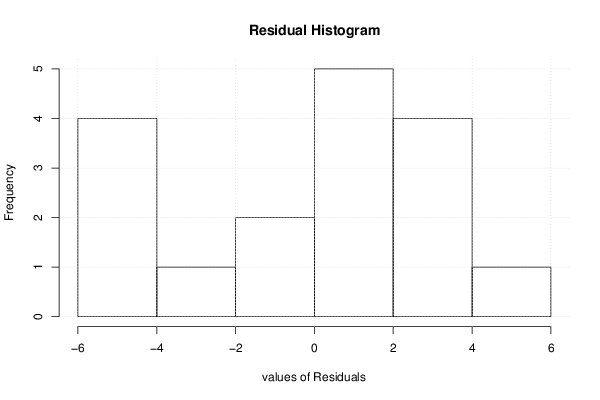
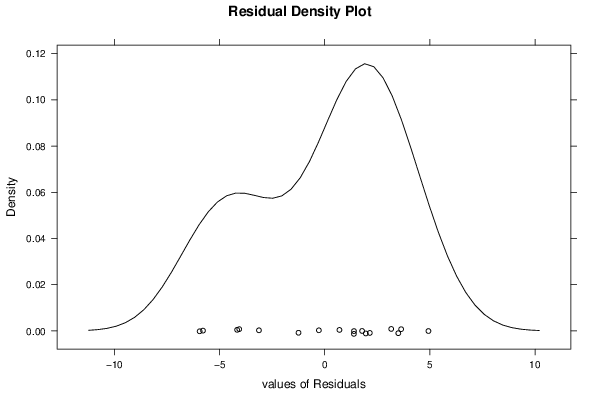
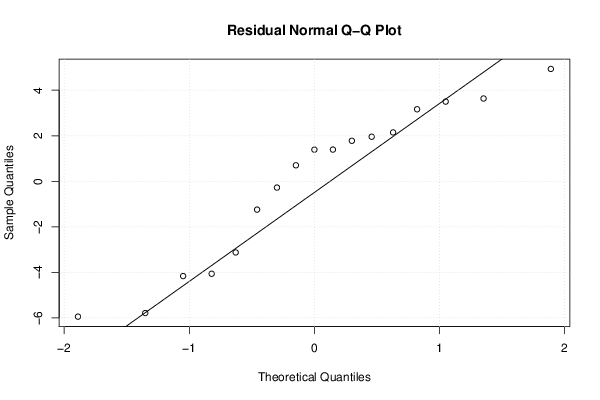
| Multiple Linear Regression - Residual Statistics | |
| Residual Standard Deviation | 3.82097374023926 |
| Sum Squared Residuals | 189.797924206774 |
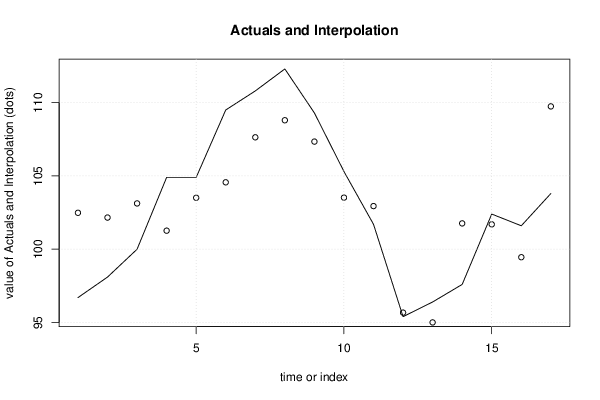
| Multiple Linear Regression - Actuals, Interpolation, and Residuals | |||
| Time or Index | Actuals | Interpolation Forecast | Residuals Prediction Error |
| 1 | 96.7 | 102.485695697259 | -5.78569569725907 |
| 2 | 98.1 | 102.160886279053 | -4.06088627905297 |
| 3 | 100 | 103.125010449863 | -3.1250104498634 |
| 4 | 104.9 | 101.264598028339 | 3.6354019716611 |
| 5 | 104.9 | 103.510544499595 | 1.38945550040485 |
| 6 | 109.5 | 104.566233052642 | 4.93376694735798 |
| 7 | 110.8 | 107.636812045975 | 3.16318795402505 |
| 8 | 112.3 | 108.80002585511 | 3.4999741448898 |
| 9 | 109.3 | 107.343336887601 | 1.95666311239891 |
| 10 | 105.3 | 103.521118453701 | 1.77888154629892 |
| 11 | 101.7 | 102.943924258322 | -1.24392425832189 |
| 12 | 95.4 | 95.6758141254335 | -0.275814125433541 |
| 13 | 96.4 | 95.0072662587556 | 1.39273374124439 |
| 14 | 97.6 | 101.762491758489 | -4.16249175848939 |
| 15 | 102.4 | 101.697178406027 | 0.702821593972941 |
| 16 | 101.6 | 99.4541656852617 | 2.14583431473834 |
| 17 | 103.8 | 109.744898258572 | -5.94489825857202 |