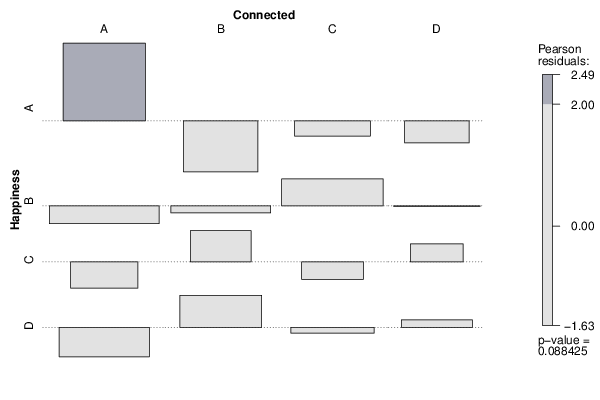
| Tabulation of Results | ||||
| Happiness x Connected | ||||
| A | B | C | D | A | 14 | 2 | 5 | 3 | B | 11 | 10 | 14 | 8 | C | 3 | 6 | 3 | 4 | D | 6 | 10 | 7 | 6 |
| Tabulation of Expected Results | ||||
| Happiness x Connected | ||||
| A | B | C | D | A | 7.29 | 6 | 6.21 | 4.5 | B | 13.05 | 10.75 | 11.13 | 8.06 | C | 4.86 | 4 | 4.14 | 3 | D | 8.8 | 7.25 | 7.51 | 5.44 |
| Statistical Results | |
| Pearson's Chi-squared test with simulated p-value (based on 2000 replicates) | |
| Exact Pearson Chi Square Statistic | 15.09 |
| P value | 0.08 |