| Tabulation of Results | ||||
| Happiness x Separate | ||||
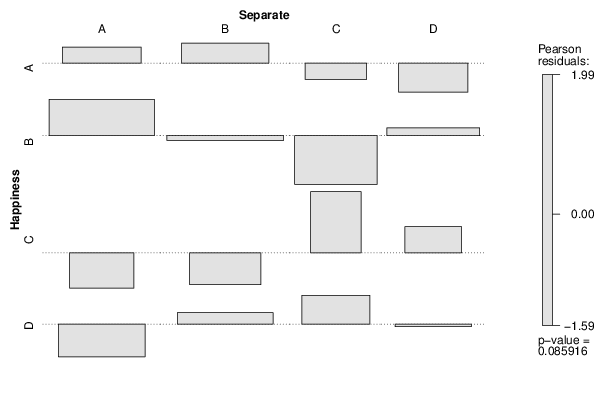
| A | B | C | D | A | 8 | 10 | 3 | 3 | B | 16 | 14 | 3 | 10 | C | 2 | 3 | 6 | 5 | D | 5 | 11 | 7 | 6 |
| Tabulation of Expected Results | ||||
| Happiness x Separate | ||||
| A | B | C | D | A | 6.64 | 8.14 | 4.07 | 5.14 | B | 11.9 | 14.59 | 7.29 | 9.21 | C | 4.43 | 5.43 | 2.71 | 3.43 | D | 8.03 | 9.84 | 4.92 | 6.21 |
| Statistical Results | |
| Pearson's Chi-squared test with simulated p-value (based on 2000 replicates) | |
| Exact Pearson Chi Square Statistic | 15.19 |
| P value | 0.08 |