| Multiple Linear Regression - Estimated Regression Equation |
| TP[t] = -0.0121356415311825 + 0.000805683855140832TFC[t] + 1.00000036949678TLC[t] + e[t] |
| Multiple Linear Regression - Ordinary Least Squares | |||||
| Variable | Parameter | S.D. | T-STAT H0: parameter = 0 | 2-tail p-value | 1-tail p-value |
| (Intercept) | -0.0121356415311825 | 0.006854 | -1.7707 | 0.088806 | 0.044403 |
| TFC | 0.000805683855140832 | 7.6e-05 | 10.6006 | 0 | 0 |
| TLC | 1.00000036949678 | 1.9e-05 | 51897.3817 | 0 | 0 |
| Multiple Linear Regression - Regression Statistics | |
| Multiple R | 0.999999995538385 |
| R-squared | 0.999999991076769 |
| Adjusted R-squared | 0.999999990362911 |
| F-TEST (value) | 1400837944.98238 |
| F-TEST (DF numerator) | 2 |
| F-TEST (DF denominator) | 25 |
| p-value | 0 |
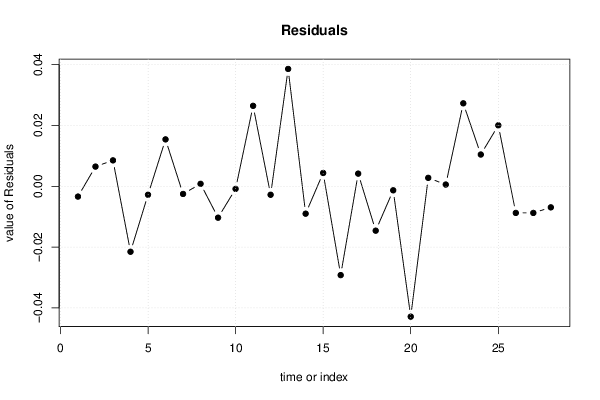
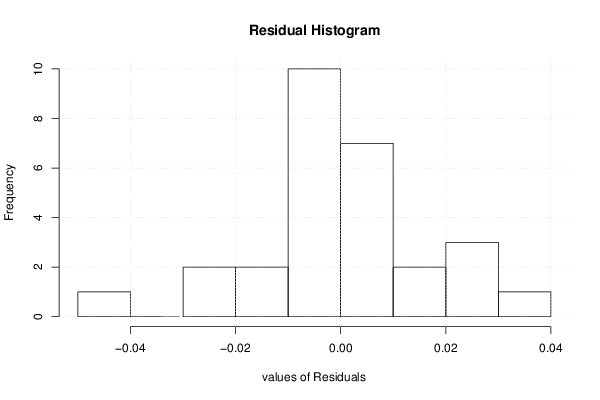
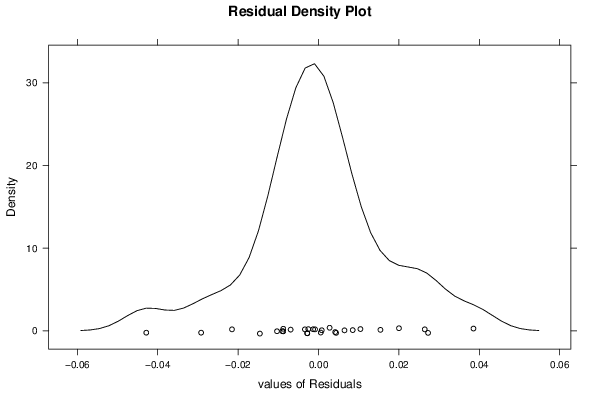
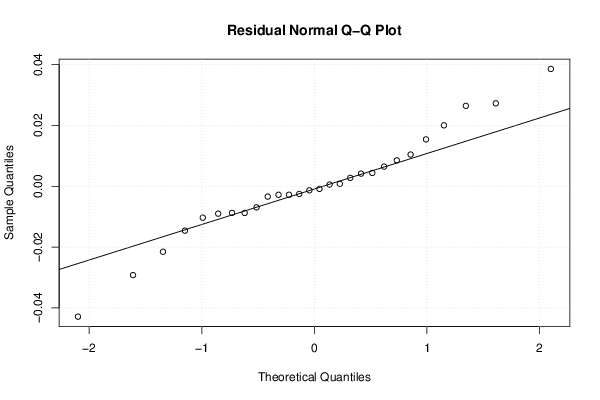
| Multiple Linear Regression - Residual Statistics | |
| Residual Standard Deviation | 0.017464285786839 |
| Sum Squared Residuals | 0.00762503195110968 |
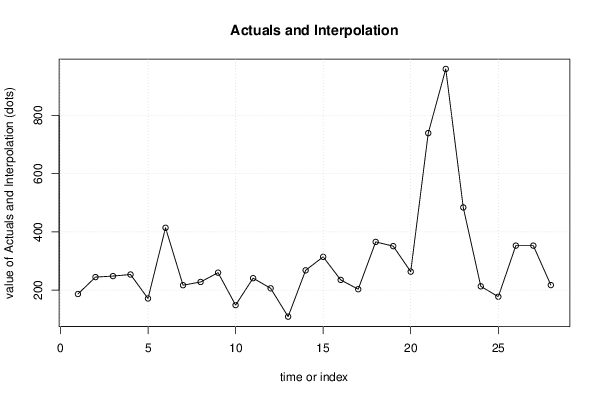
| Multiple Linear Regression - Actuals, Interpolation, and Residuals | |||
| Time or Index | Actuals | Interpolation Forecast | Residuals Prediction Error |
| 1 | 186.59 | 186.593392468886 | -0.00339246888560547 |
| 2 | 244.665 | 244.658538804714 | 0.00646119528615234 |
| 3 | 248.18 | 248.171493012305 | 0.00850698769533448 |
| 4 | 253.568 | 253.589528480222 | -0.0215284802215854 |
| 5 | 171.242 | 171.244792058849 | -0.00279205884871004 |
| 6 | 413.971 | 413.95559337712 | 0.0154066228798805 |
| 7 | 216.89 | 216.892534627559 | -0.00253462755911449 |
| 8 | 227.901 | 227.900197525141 | 0.000802474859051047 |
| 9 | 259.823 | 259.833327901733 | -0.010327901733285 |
| 10 | 148.438 | 148.438862516965 | -0.000862516965367679 |
| 11 | 241.013 | 240.986572534833 | 0.0264274651665664 |
| 12 | 206.248 | 206.250796571047 | -0.00279657104653548 |
| 13 | 108.908 | 108.869447252608 | 0.0385527473917054 |
| 14 | 267.952 | 267.961010023966 | -0.00901002396600199 |
| 15 | 314.219 | 314.214624193414 | 0.00437580658550967 |
| 16 | 235.115 | 235.144203857456 | -0.0292038574561778 |
| 17 | 203.027 | 203.022852216297 | 0.00414778370341505 |
| 18 | 365.415 | 365.429595002195 | -0.0145950021944671 |
| 19 | 350.933 | 350.934335774206 | -0.00133577420574537 |
| 20 | 263.304 | 263.346854423931 | -0.0428544239306001 |
| 21 | 738.751 | 738.74823635009 | 0.00276364991047115 |
| 22 | 959.073 | 959.072443373623 | 0.000556626377130978 |
| 23 | 483.828 | 483.800744614198 | 0.027255385801997 |
| 24 | 213.016 | 213.005574059949 | 0.0104259400512732 |
| 25 | 177.341 | 177.320981224956 | 0.0200187750442203 |
| 26 | 352.622 | 352.630766712989 | -0.00876671298891675 |
| 27 | 352.622 | 352.630766712989 | -0.00876671298891675 |
| 28 | 217.307 | 217.313934327762 | -0.00693432776167822 |
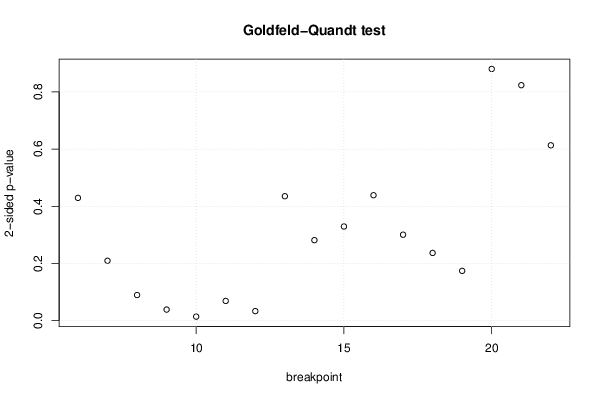
| Goldfeld-Quandt test for Heteroskedasticity | |||
| p-values | Alternative Hypothesis | ||
| breakpoint index | greater | 2-sided | less |
| 6 | 0.214676801509356 | 0.429353603018713 | 0.785323198490644 |
| 7 | 0.104758703271921 | 0.209517406543842 | 0.895241296728079 |
| 8 | 0.0448401398892139 | 0.0896802797784278 | 0.955159860110786 |
| 9 | 0.0193674056287727 | 0.0387348112575453 | 0.980632594371227 |
| 10 | 0.00701715604211462 | 0.0140343120842292 | 0.992982843957885 |
| 11 | 0.0345113873211793 | 0.0690227746423586 | 0.965488612678821 |
| 12 | 0.0166816430943984 | 0.0333632861887967 | 0.983318356905602 |
| 13 | 0.217588012770317 | 0.435176025540635 | 0.782411987229683 |
| 14 | 0.140750891690266 | 0.281501783380532 | 0.859249108309734 |
| 15 | 0.16463001554242 | 0.32926003108484 | 0.83536998445758 |
| 16 | 0.219337340079477 | 0.438674680158955 | 0.780662659920523 |
| 17 | 0.150290375414252 | 0.300580750828504 | 0.849709624585748 |
| 18 | 0.118427347032228 | 0.236854694064456 | 0.881572652967772 |
| 19 | 0.0870828524724916 | 0.174165704944983 | 0.912917147527508 |
| 20 | 0.559857769118795 | 0.88028446176241 | 0.440142230881205 |
| 21 | 0.411703571086071 | 0.823407142172143 | 0.588296428913929 |
| 22 | 0.693388879297575 | 0.613222241404851 | 0.306611120702425 |
| Meta Analysis of Goldfeld-Quandt test for Heteroskedasticity | |||
| Description | # significant tests | % significant tests | OK/NOK |
| 1% type I error level | 0 | 0 | OK |
| 5% type I error level | 3 | 0.176470588235294 | NOK |
| 10% type I error level | 5 | 0.294117647058824 | NOK |