| Multiple Linear Regression - Estimated Regression Equation |
| Broodje[t] = -7.42691561583133 + 1.04811765014689Speciaal400[t] -2.61442964511642Speciaal800[t] + 3.2573469180311Bruin800[t] -2.70183108968819Meergranen800[t] + 3.94236892588218Kramiek[t] + e[t] |
| Multiple Linear Regression - Ordinary Least Squares | |||||
| Variable | Parameter | S.D. | T-STAT H0: parameter = 0 | 2-tail p-value | 1-tail p-value |
| (Intercept) | -7.42691561583133 | 1.460147 | -5.0864 | 7e-06 | 4e-06 |
| Speciaal400 | 1.04811765014689 | 1.811427 | 0.5786 | 0.5658 | 0.2829 |
| Speciaal800 | -2.61442964511642 | 2.218679 | -1.1784 | 0.244982 | 0.122491 |
| Bruin800 | 3.2573469180311 | 1.983677 | 1.6421 | 0.107704 | 0.053852 |
| Meergranen800 | -2.70183108968819 | 1.201291 | -2.2491 | 0.029561 | 0.014781 |
| Kramiek | 3.94236892588218 | 0.334449 | 11.7876 | 0 | 0 |
| Multiple Linear Regression - Regression Statistics | |
| Multiple R | 0.987734791703141 |
| R-squared | 0.975620018740847 |
| Adjusted R-squared | 0.972849566325034 |
| F-TEST (value) | 352.151877134699 |
| F-TEST (DF numerator) | 5 |
| F-TEST (DF denominator) | 44 |
| p-value | 0 |
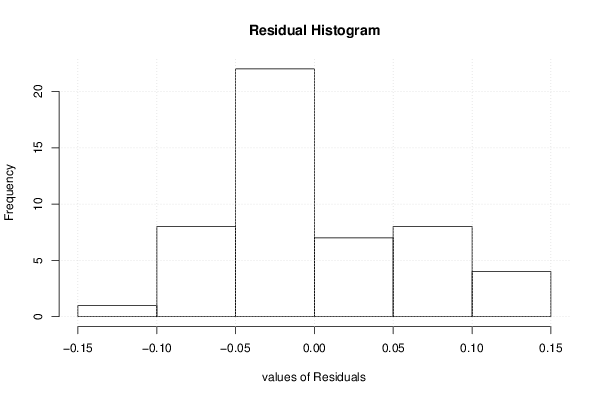
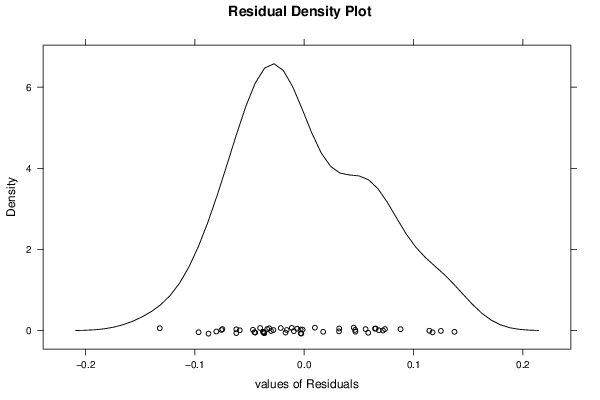
| Multiple Linear Regression - Residual Statistics | |
| Residual Standard Deviation | 0.0657388851358332 |
| Sum Squared Residuals | 0.1901504448317 |
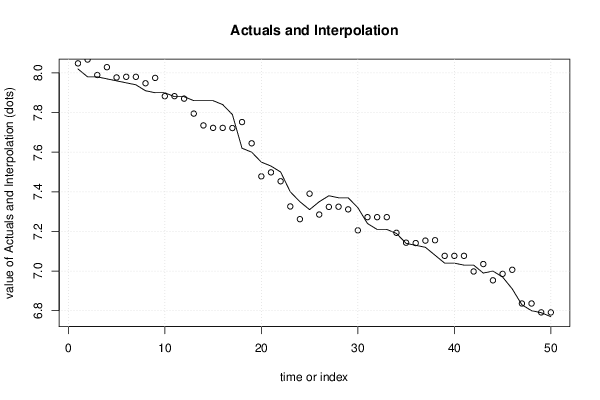
| Multiple Linear Regression - Actuals, Interpolation, and Residuals | |||
| Time or Index | Actuals | Interpolation Forecast | Residuals Prediction Error |
| 1 | 8.02 | 8.04813038727822 | -0.0281303872782162 |
| 2 | 7.98 | 8.06742446365087 | -0.0874244636508691 |
| 3 | 7.98 | 7.98945109957894 | -0.00945109957894154 |
| 4 | 7.97 | 8.02887478883777 | -0.0588747888377666 |
| 5 | 7.96 | 7.977045721217 | -0.0170457212170024 |
| 6 | 7.95 | 7.98030346280476 | -0.0303034628047589 |
| 7 | 7.94 | 7.98030346280476 | -0.0403034628047588 |
| 8 | 7.91 | 7.94772999362445 | -0.0377299936244479 |
| 9 | 7.9 | 7.97474830452133 | -0.074748304521329 |
| 10 | 7.9 | 7.88262153319603 | 0.0173784668039731 |
| 11 | 7.88 | 7.88262153319603 | -0.00262153319602736 |
| 12 | 7.88 | 7.87021615483409 | 0.00978384516591103 |
| 13 | 7.86 | 7.7946265179042 | 0.0653734820958012 |
| 14 | 7.86 | 7.73503473782701 | 0.124965262172994 |
| 15 | 7.86 | 7.72262935946507 | 0.137370640534933 |
| 16 | 7.84 | 7.72262935946507 | 0.117370640534933 |
| 17 | 7.79 | 7.72175534501935 | 0.06824465498065 |
| 18 | 7.62 | 7.75203139750399 | -0.132031397503988 |
| 19 | 7.6 | 7.64474230583951 | -0.044742305839506 |
| 20 | 7.55 | 7.4779477445442 | 0.0720522554558047 |
| 21 | 7.53 | 7.49811583536257 | 0.0318841646374337 |
| 22 | 7.5 | 7.45313698782031 | 0.0468630121796865 |
| 23 | 7.4 | 7.32613933061903 | 0.073860669380973 |
| 24 | 7.35 | 7.26190488463633 | 0.0880951153636712 |
| 25 | 7.31 | 7.39028391407906 | -0.0802839140790565 |
| 26 | 7.35 | 7.28529223911025 | 0.0647077608897491 |
| 27 | 7.38 | 7.32384191392335 | 0.056158086076646 |
| 28 | 7.37 | 7.32471592836907 | 0.0452840716309286 |
| 29 | 7.37 | 7.31143653556141 | 0.0585634644385858 |
| 30 | 7.32 | 7.20557084614689 | 0.114429153853109 |
| 31 | 7.24 | 7.27201284630259 | -0.0320128463025931 |
| 32 | 7.21 | 7.27201284630259 | -0.0620128463025933 |
| 33 | 7.21 | 7.27201284630259 | -0.0620128463025933 |
| 34 | 7.19 | 7.19316546778495 | -0.00316546778494753 |
| 35 | 7.14 | 7.14326060202466 | -0.00326060202465832 |
| 36 | 7.13 | 7.14133640016419 | -0.0113364001641886 |
| 37 | 7.12 | 7.15374177852613 | -0.0337417785261268 |
| 38 | 7.08 | 7.1556659803866 | -0.0756659803865976 |
| 39 | 7.04 | 7.07681860186896 | -0.0368186018689557 |
| 40 | 7.04 | 7.07681860186896 | -0.0368186018689557 |
| 41 | 7.03 | 7.07681860186896 | -0.0468186018689555 |
| 42 | 7.03 | 6.99797122335131 | 0.0320287766486899 |
| 43 | 6.99 | 7.03547071074966 | -0.0454707107496604 |
| 44 | 7 | 6.95336559064426 | 0.0466344093557363 |
| 45 | 6.97 | 6.98593905982457 | -0.015939059824575 |
| 46 | 6.91 | 7.00652819799231 | -0.0965281979923085 |
| 47 | 6.83 | 6.83642806259508 | -0.00642806259508285 |
| 48 | 6.8 | 6.83642806259508 | -0.0364280625950831 |
| 49 | 6.79 | 6.79144921505283 | -0.00144921505283227 |
| 50 | 6.77 | 6.79144921505283 | -0.0214492150528327 |
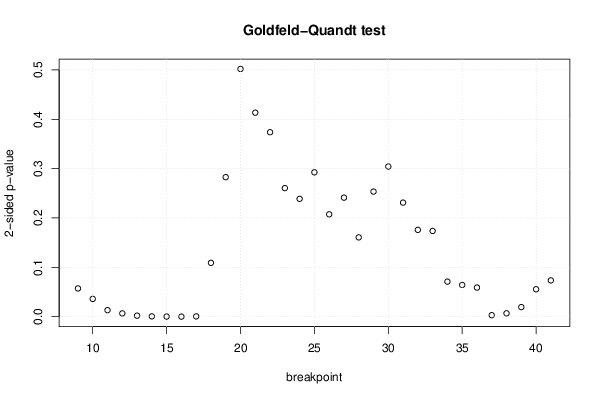
| Goldfeld-Quandt test for Heteroskedasticity | |||
| p-values | Alternative Hypothesis | ||
| breakpoint index | greater | 2-sided | less |
| 9 | 0.0286112398718729 | 0.0572224797437459 | 0.971388760128127 |
| 10 | 0.018027039300202 | 0.036054078600404 | 0.981972960699798 |
| 11 | 0.00659391287672156 | 0.0131878257534431 | 0.993406087123278 |
| 12 | 0.00333395292696867 | 0.00666790585393735 | 0.996666047073031 |
| 13 | 0.00102582151891101 | 0.00205164303782203 | 0.998974178481089 |
| 14 | 0.000314462564841599 | 0.000628925129683197 | 0.999685537435158 |
| 15 | 0.000120418122967972 | 0.000240836245935943 | 0.999879581877032 |
| 16 | 3.38774219488408e-05 | 6.77548438976817e-05 | 0.999966122578051 |
| 17 | 0.000297560313790832 | 0.000595120627581664 | 0.999702439686209 |
| 18 | 0.0545369156099051 | 0.10907383121981 | 0.945463084390095 |
| 19 | 0.141348303345457 | 0.282696606690915 | 0.858651696654543 |
| 20 | 0.250966088039983 | 0.501932176079967 | 0.749033911960017 |
| 21 | 0.206654037122055 | 0.41330807424411 | 0.793345962877945 |
| 22 | 0.186866136446901 | 0.373732272893803 | 0.813133863553099 |
| 23 | 0.130248792674276 | 0.260497585348552 | 0.869751207325724 |
| 24 | 0.119401339952221 | 0.238802679904443 | 0.880598660047779 |
| 25 | 0.146246349466071 | 0.292492698932142 | 0.853753650533929 |
| 26 | 0.103721535094281 | 0.207443070188562 | 0.896278464905719 |
| 27 | 0.120586921166997 | 0.241173842333994 | 0.879413078833003 |
| 28 | 0.0803419022594276 | 0.160683804518855 | 0.919658097740572 |
| 29 | 0.126731776065052 | 0.253463552130104 | 0.873268223934948 |
| 30 | 0.84788793474062 | 0.30422413051876 | 0.15211206525938 |
| 31 | 0.884436880705311 | 0.231126238589378 | 0.115563119294689 |
| 32 | 0.912046392152253 | 0.175907215695494 | 0.0879536078477469 |
| 33 | 0.913132331146872 | 0.173735337706257 | 0.0868676688531285 |
| 34 | 0.964477993112868 | 0.0710440137742642 | 0.0355220068871321 |
| 35 | 0.967867700318619 | 0.064264599362761 | 0.0321322996813805 |
| 36 | 0.970495648481237 | 0.0590087030375255 | 0.0295043515187628 |
| 37 | 0.99849643091403 | 0.00300713817194001 | 0.00150356908597001 |
| 38 | 0.996585488316232 | 0.00682902336753531 | 0.00341451168376765 |
| 39 | 0.990313691020988 | 0.019372617958024 | 0.00968630897901198 |
| 40 | 0.972208471149724 | 0.0555830577005526 | 0.0277915288502763 |
| 41 | 0.963230239867733 | 0.0735395202645347 | 0.0367697601322673 |
| Meta Analysis of Goldfeld-Quandt test for Heteroskedasticity | |||
| Description | # significant tests | % significant tests | OK/NOK |
| 1% type I error level | 8 | 0.242424242424242 | NOK |
| 5% type I error level | 11 | 0.333333333333333 | NOK |
| 10% type I error level | 17 | 0.515151515151515 | NOK |