| Multiple Linear Regression - Estimated Regression Equation |
| Inschrijvingen[t] = + 29959.2731630029 -0.105538917324627Data[t] + 245.470362255477Rentevoet[t] + e[t] |
| Multiple Linear Regression - Ordinary Least Squares | |||||
| Variable | Parameter | S.D. | T-STAT H0: parameter = 0 | 2-tail p-value | 1-tail p-value |
| (Intercept) | 29959.2731630029 | 1266.392446 | 23.6572 | 0 | 0 |
| Data | -0.105538917324627 | 0.013921 | -7.581 | 0 | 0 |
| Rentevoet | 245.470362255477 | 387.292433 | 0.6338 | 0.528696 | 0.264348 |
| Multiple Linear Regression - Regression Statistics | |
| Multiple R | 0.705900168530578 |
| R-squared | 0.498295047931498 |
| Adjusted R-squared | 0.480994877170516 |
| F-TEST (value) | 28.8028976601379 |
| F-TEST (DF numerator) | 2 |
| F-TEST (DF denominator) | 58 |
| p-value | 2.05590600099725e-09 |
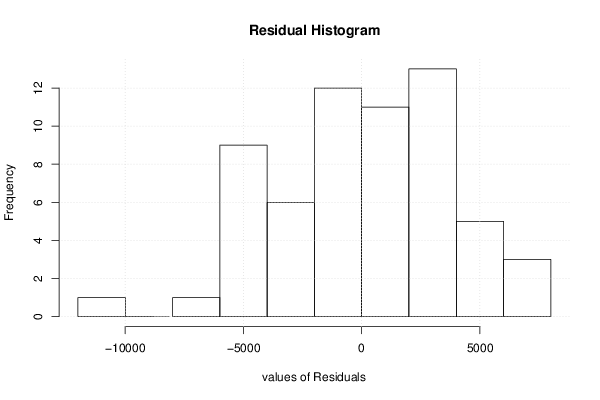
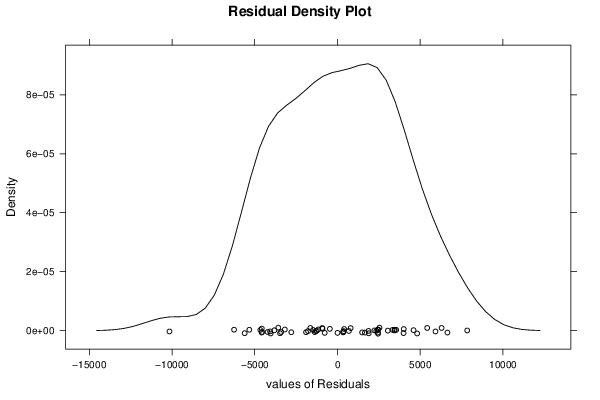
| Multiple Linear Regression - Residual Statistics | |
| Residual Standard Deviation | 3769.93459688149 |
| Sum Squared Residuals | 824319598.156313 |
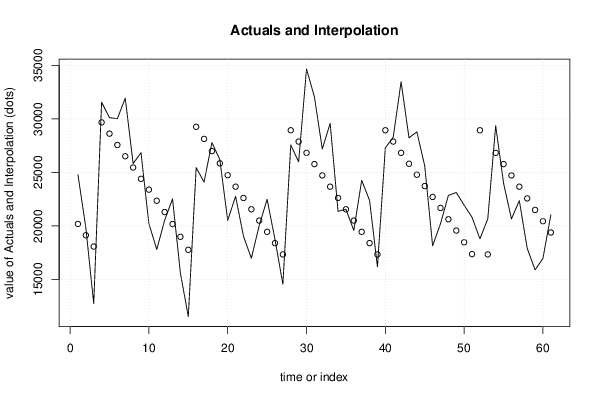
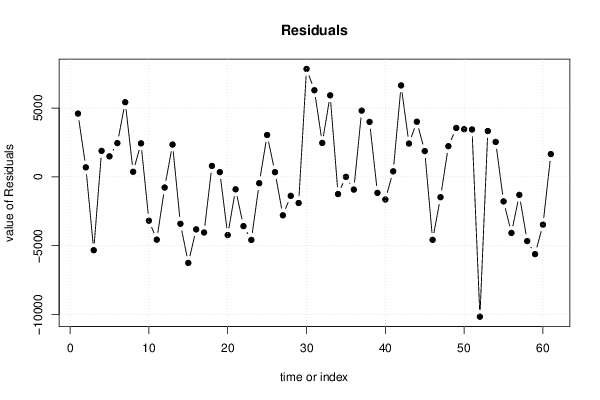
| Multiple Linear Regression - Actuals, Interpolation, and Residuals | |||
| Time or Index | Actuals | Interpolation Forecast | Residuals Prediction Error |
| 1 | 24776 | 20175.4462724915 | 4600.55372750847 |
| 2 | 19814 | 19120.0570992453 | 693.942900754728 |
| 3 | 12738 | 18064.667925999 | -5326.667925999 |
| 4 | 31566 | 29673.8432927906 | 1892.15670720936 |
| 5 | 30111 | 28618.4541195444 | 1492.54588045563 |
| 6 | 30019 | 27563.0649462981 | 2455.9350537019 |
| 7 | 31934 | 26507.6757730518 | 5426.32422694817 |
| 8 | 25826 | 25452.2865998056 | 373.713400194439 |
| 9 | 26835 | 24396.8974265593 | 2438.10257344071 |
| 10 | 20205 | 23385.692918519 | -3180.69291851901 |
| 11 | 17789 | 22347.4866706306 | -4558.48667063062 |
| 12 | 20520 | 21292.0974973844 | -772.097497384355 |
| 13 | 22518 | 20167.9766227066 | 2350.02337729345 |
| 14 | 15572 | 18977.5787502198 | -3405.57875021977 |
| 15 | 11509 | 17757.7244342623 | -6248.72443426233 |
| 16 | 25447 | 29258.8928416616 | -3811.89284166156 |
| 17 | 24090 | 28127.4078561161 | -4037.40785611609 |
| 18 | 27786 | 26988.558759703 | 797.441240297042 |
| 19 | 26195 | 25847.2549596673 | 347.745040332728 |
| 20 | 20516 | 24737.8623067248 | -4221.8623067248 |
| 21 | 22759 | 23660.3808008755 | -901.380800875536 |
| 22 | 19028 | 22604.9916276293 | -3576.99162762927 |
| 23 | 16971 | 21549.602454383 | -4578.602454383 |
| 24 | 20036 | 20494.2132811367 | -458.213281136729 |
| 25 | 22485 | 19438.8241078905 | 3046.17589210954 |
| 26 | 18730 | 18383.4349346442 | 346.565065355808 |
| 27 | 14538 | 17328.0457613979 | -2790.04576139792 |
| 28 | 27561 | 28937.2211281896 | -1376.22112818956 |
| 29 | 25985 | 27881.8319549433 | -1896.83195494329 |
| 30 | 34670 | 26826.442781697 | 7843.55721830298 |
| 31 | 32066 | 25771.0536084508 | 6294.94639154925 |
| 32 | 27186 | 24715.6644352045 | 2470.33556479552 |
| 33 | 29586 | 23660.2752619582 | 5925.72473804179 |
| 34 | 21359 | 22604.8860887119 | -1245.88608871194 |
| 35 | 21553 | 21549.4969154657 | 3.50308453432638 |
| 36 | 19573 | 20494.1077422194 | -921.107742219405 |
| 37 | 24256 | 19438.7185689731 | 4817.28143102686 |
| 38 | 22380 | 18383.3293957269 | 3996.67060427313 |
| 39 | 16167 | 17327.9402224806 | -1160.9402224806 |
| 40 | 27297 | 28937.1155892722 | -1640.11558927223 |
| 41 | 28287 | 27881.726416026 | 405.273583974036 |
| 42 | 33474 | 26826.3372427797 | 6647.66275722031 |
| 43 | 28229 | 25805.3139202492 | 2423.68607975081 |
| 44 | 28785 | 24776.926486851 | 4008.07351314897 |
| 45 | 25597 | 23721.5373136048 | 1875.46268639524 |
| 46 | 18130 | 22702.9686946968 | -4572.96869469681 |
| 47 | 20198 | 21672.1265576761 | -1474.12655767609 |
| 48 | 22849 | 20616.7373844298 | 2232.26261557018 |
| 49 | 23118 | 19561.3482111836 | 3556.65178881645 |
| 50 | 21925 | 18461.7743727313 | 3463.22562726871 |
| 51 | 20801 | 17354.8364234114 | 3446.16357658862 |
| 52 | 18785 | 28937.0100503549 | -10152.0100503549 |
| 53 | 20659 | 17327.7291446459 | 3331.27085535405 |
| 54 | 29367 | 26826.2317038624 | 2540.76829613763 |
| 55 | 23992 | 25770.8425306161 | -1778.8425306161 |
| 56 | 20645 | 24715.4533573698 | -4070.45335736983 |
| 57 | 22356 | 23660.0641841236 | -1304.06418412356 |
| 58 | 17902 | 22562.9450492939 | -4660.94504929386 |
| 59 | 15879 | 21487.9182470672 | -5608.91824706716 |
| 60 | 16963 | 20432.5290738209 | -3469.52907382089 |
| 61 | 21035 | 19377.1399005746 | 1657.86009942538 |
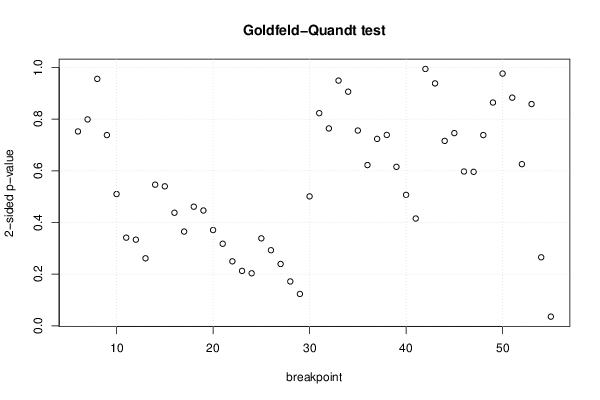
| Goldfeld-Quandt test for Heteroskedasticity | |||
| p-values | Alternative Hypothesis | ||
| breakpoint index | greater | 2-sided | less |
| 6 | 0.623904753213493 | 0.752190493573014 | 0.376095246786507 |
| 7 | 0.600618694593008 | 0.798762610813984 | 0.399381305406992 |
| 8 | 0.47778915886499 | 0.95557831772998 | 0.52221084113501 |
| 9 | 0.36909032642006 | 0.738180652840121 | 0.63090967357994 |
| 10 | 0.254963435059048 | 0.509926870118097 | 0.745036564940952 |
| 11 | 0.170490265423317 | 0.340980530846633 | 0.829509734576683 |
| 12 | 0.166662994730407 | 0.333325989460815 | 0.833337005269593 |
| 13 | 0.130566210373576 | 0.261132420747153 | 0.869433789626424 |
| 14 | 0.273055658642268 | 0.546111317284535 | 0.726944341357732 |
| 15 | 0.269860910020367 | 0.539721820040735 | 0.730139089979633 |
| 16 | 0.218706118821063 | 0.437412237642125 | 0.781293881178937 |
| 17 | 0.18229410930787 | 0.364588218615739 | 0.81770589069213 |
| 18 | 0.230433748272856 | 0.460867496545712 | 0.769566251727144 |
| 19 | 0.223079681294519 | 0.446159362589038 | 0.776920318705481 |
| 20 | 0.185262478180745 | 0.370524956361489 | 0.814737521819255 |
| 21 | 0.158715411523296 | 0.317430823046592 | 0.841284588476704 |
| 22 | 0.124731155090385 | 0.24946231018077 | 0.875268844909615 |
| 23 | 0.106163337598028 | 0.212326675196057 | 0.893836662401972 |
| 24 | 0.101558519157554 | 0.203117038315107 | 0.898441480842446 |
| 25 | 0.169194851354452 | 0.338389702708904 | 0.830805148645548 |
| 26 | 0.146190034403424 | 0.292380068806848 | 0.853809965596576 |
| 27 | 0.119571225201316 | 0.239142450402632 | 0.880428774798684 |
| 28 | 0.0857715131354334 | 0.171543026270867 | 0.914228486864567 |
| 29 | 0.0615588626074991 | 0.123117725214998 | 0.938441137392501 |
| 30 | 0.250460663515403 | 0.500921327030806 | 0.749539336484597 |
| 31 | 0.411461432699819 | 0.822922865399639 | 0.588538567300181 |
| 32 | 0.381922762970712 | 0.763845525941423 | 0.618077237029288 |
| 33 | 0.525522519674898 | 0.948954960650205 | 0.474477480325102 |
| 34 | 0.453034204806958 | 0.906068409613917 | 0.546965795193042 |
| 35 | 0.37787223775002 | 0.755744475500041 | 0.62212776224998 |
| 36 | 0.311061698147214 | 0.622123396294427 | 0.688938301852786 |
| 37 | 0.361687565374051 | 0.723375130748101 | 0.638312434625949 |
| 38 | 0.369348224241125 | 0.73869644848225 | 0.630651775758875 |
| 39 | 0.307593290128316 | 0.615186580256633 | 0.692406709871684 |
| 40 | 0.253365253286837 | 0.506730506573675 | 0.746634746713163 |
| 41 | 0.207556037065841 | 0.415112074131681 | 0.792443962934159 |
| 42 | 0.502934290676149 | 0.994131418647702 | 0.497065709323851 |
| 43 | 0.530933485095807 | 0.938133029808387 | 0.469066514904193 |
| 44 | 0.642196605949429 | 0.715606788101143 | 0.357803394050571 |
| 45 | 0.627136279952943 | 0.745727440094113 | 0.372863720047057 |
| 46 | 0.701386443168857 | 0.597227113662285 | 0.298613556831142 |
| 47 | 0.702059696651375 | 0.595880606697251 | 0.297940303348625 |
| 48 | 0.630934250307959 | 0.738131499384082 | 0.369065749692041 |
| 49 | 0.567923616809473 | 0.864152766381055 | 0.432076383190527 |
| 50 | 0.511889888124669 | 0.976220223750662 | 0.488110111875331 |
| 51 | 0.441539514952776 | 0.883079029905552 | 0.558460485047224 |
| 52 | 0.687228790889146 | 0.625542418221708 | 0.312771209110854 |
| 53 | 0.570891275545399 | 0.858217448909203 | 0.429108724454602 |
| 54 | 0.867481398958118 | 0.265037202083763 | 0.132518601041882 |
| 55 | 0.982376018736082 | 0.0352479625278365 | 0.0176239812639182 |
| Meta Analysis of Goldfeld-Quandt test for Heteroskedasticity | |||
| Description | # significant tests | % significant tests | OK/NOK |
| 1% type I error level | 0 | 0 | OK |
| 5% type I error level | 1 | 0.02 | OK |
| 10% type I error level | 1 | 0.02 | OK |