| Multiple Linear Regression - Estimated Regression Equation |
| TimeRFC[t] = + 6502.71131416814 + 829.756999128733`#Logins`[t] + 0.196074056762163`#characters`[t] -0.773163781215985`#revisions`[t] + 1.63206035759499`#seconds`[t] -22.8244576103107`#Hyperlinks`[t] -514.112233299791`#Blogs`[t] + 493.81343133437t + e[t] |
| Multiple Linear Regression - Ordinary Least Squares | |||||
| Variable | Parameter | S.D. | T-STAT H0: parameter = 0 | 2-tail p-value | 1-tail p-value |
| (Intercept) | 6502.71131416814 | 7286.857155 | 0.8924 | 0.37906 | 0.18953 |
| `#Logins` | 829.756999128733 | 188.940942 | 4.3916 | 0.000122 | 6.1e-05 |
| `#characters` | 0.196074056762163 | 0.173688 | 1.1289 | 0.267606 | 0.133803 |
| `#revisions` | -0.773163781215985 | 1.559134 | -0.4959 | 0.623467 | 0.311734 |
| `#seconds` | 1.63206035759499 | 0.362691 | 4.4999 | 9e-05 | 4.5e-05 |
| `#Hyperlinks` | -22.8244576103107 | 1806.832018 | -0.0126 | 0.990002 | 0.495001 |
| `#Blogs` | -514.112233299791 | 1752.668316 | -0.2933 | 0.771224 | 0.385612 |
| t | 493.81343133437 | 213.689193 | 2.3109 | 0.027657 | 0.013828 |
| Multiple Linear Regression - Regression Statistics | |
| Multiple R | 0.913547383021878 |
| R-squared | 0.834568821026122 |
| Adjusted R-squared | 0.797213393515892 |
| F-TEST (value) | 22.3413002246477 |
| F-TEST (DF numerator) | 7 |
| F-TEST (DF denominator) | 31 |
| p-value | 1.88317139659944e-10 |
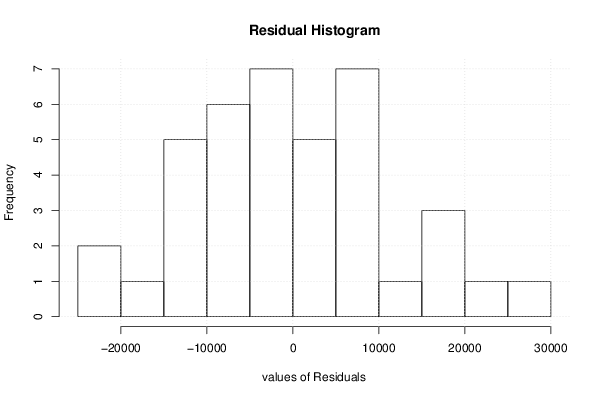
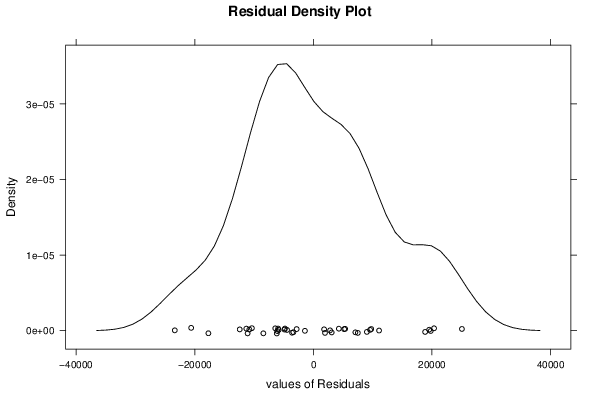
| Multiple Linear Regression - Residual Statistics | |
| Residual Standard Deviation | 12748.4738340144 |
| Sum Squared Residuals | 5038231137.99305 |
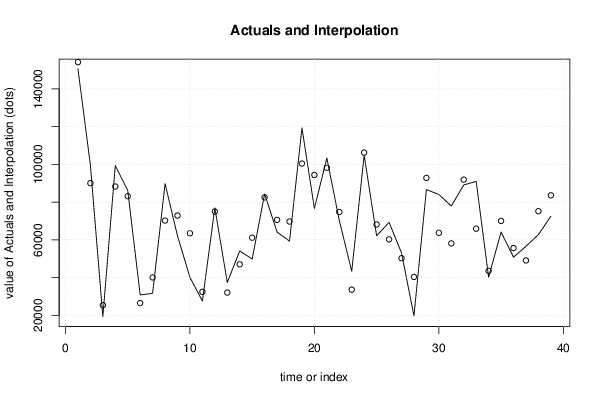
| Multiple Linear Regression - Actuals, Interpolation, and Residuals | |||
| Time or Index | Actuals | Interpolation Forecast | Residuals Prediction Error |
| 1 | 150580 | 154182.021922562 | -3602.02192256182 |
| 2 | 99611 | 90051.0170612024 | 9559.98293879762 |
| 3 | 19349 | 25424.674319241 | -6075.67431924101 |
| 4 | 99373 | 88300.8262783929 | 11072.1737216071 |
| 5 | 86230 | 83148.4380947049 | 3081.56190529507 |
| 6 | 30837 | 26545.5229878196 | 4291.47701218041 |
| 7 | 31706 | 40146.0623660744 | -8440.06236607439 |
| 8 | 89806 | 70274.6089005751 | 19531.3910994249 |
| 9 | 62088 | 72891.5444209086 | -10803.5444209086 |
| 10 | 40151 | 63528.954979804 | -23377.954979804 |
| 11 | 27634 | 32512.3300439796 | -4878.33004397958 |
| 12 | 76990 | 75034.3411109396 | 1955.65888906039 |
| 13 | 37460 | 32105.633120253 | 5354.366879747 |
| 14 | 54157 | 47075.3475159651 | 7081.65248403491 |
| 15 | 49862 | 61178.8374379972 | -11316.8374379972 |
| 16 | 84337 | 82531.896961013 | 1805.10303898697 |
| 17 | 64175 | 70605.6206757834 | -6430.62067578343 |
| 18 | 59382 | 69759.2377121762 | -10377.2377121762 |
| 19 | 119308 | 100466.40855575 | 18841.5914442497 |
| 20 | 76702 | 94412.9532621454 | -17710.9532621454 |
| 21 | 103425 | 98239.4565300566 | 5185.54346994345 |
| 22 | 70344 | 74789.9735924574 | -4445.97359245739 |
| 23 | 43410 | 33652.2726087739 | 9757.72739122607 |
| 24 | 104838 | 106267.74146462 | -1429.74146462005 |
| 25 | 62215 | 68160.6657990575 | -5945.66579905752 |
| 26 | 69304 | 60283.4225811775 | 9020.57741882246 |
| 27 | 53117 | 50306.9293218204 | 2810.07067817956 |
| 28 | 19764 | 40378.5219208979 | -20614.5219208979 |
| 29 | 86680 | 92858.7372966277 | -6178.73729662775 |
| 30 | 84105 | 63754.7750554925 | 20350.2249445075 |
| 31 | 77945 | 58163.6600252917 | 19781.3399747083 |
| 32 | 89113 | 91941.3467529301 | -2828.34675293006 |
| 33 | 91005 | 65957.7536607277 | 25047.2463392723 |
| 34 | 40248 | 43627.0319245677 | -3379.03192456775 |
| 35 | 64187 | 70053.3227322172 | -5866.32273221716 |
| 36 | 50857 | 55654.2569846724 | -4797.25698467238 |
| 37 | 56613 | 49119.5865770787 | 7493.41342292133 |
| 38 | 62792 | 75218.0965443823 | -12426.0965443823 |
| 39 | 72535 | 83631.1708998631 | -11096.1708998631 |
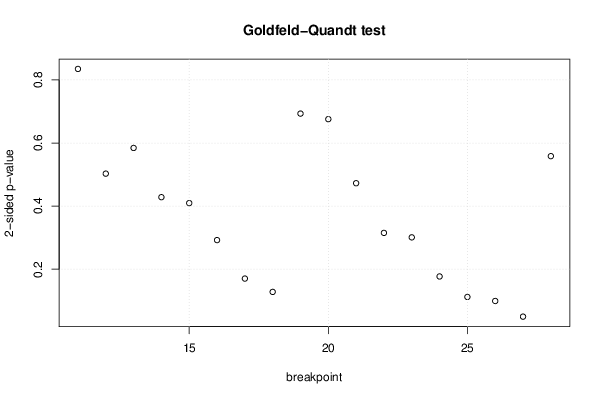
| Goldfeld-Quandt test for Heteroskedasticity | |||
| p-values | Alternative Hypothesis | ||
| breakpoint index | greater | 2-sided | less |
| 11 | 0.417383569827133 | 0.834767139654266 | 0.582616430172867 |
| 12 | 0.251446921755138 | 0.502893843510277 | 0.748553078244862 |
| 13 | 0.292209728485477 | 0.584419456970955 | 0.707790271514523 |
| 14 | 0.214164860381131 | 0.428329720762262 | 0.785835139618869 |
| 15 | 0.204781655304222 | 0.409563310608445 | 0.795218344695778 |
| 16 | 0.146201330527619 | 0.292402661055238 | 0.853798669472381 |
| 17 | 0.0852240256527937 | 0.170448051305587 | 0.914775974347206 |
| 18 | 0.0640727153609985 | 0.128145430721997 | 0.935927284639002 |
| 19 | 0.346633507671219 | 0.693267015342438 | 0.653366492328781 |
| 20 | 0.337819272463661 | 0.675638544927322 | 0.662180727536339 |
| 21 | 0.236288071943751 | 0.472576143887501 | 0.763711928056249 |
| 22 | 0.157554901520605 | 0.315109803041209 | 0.842445098479395 |
| 23 | 0.150509297730653 | 0.301018595461305 | 0.849490702269347 |
| 24 | 0.0885381509633502 | 0.1770763019267 | 0.91146184903665 |
| 25 | 0.0561034430894495 | 0.112206886178899 | 0.943896556910551 |
| 26 | 0.0496767408175191 | 0.0993534816350382 | 0.950323259182481 |
| 27 | 0.0248545407538611 | 0.0497090815077222 | 0.975145459246139 |
| 28 | 0.279185865605578 | 0.558371731211157 | 0.720814134394422 |
| Meta Analysis of Goldfeld-Quandt test for Heteroskedasticity | |||
| Description | # significant tests | % significant tests | OK/NOK |
| 1% type I error level | 0 | 0 | OK |
| 5% type I error level | 1 | 0.0555555555555556 | NOK |
| 10% type I error level | 2 | 0.111111111111111 | NOK |