| Multiple Linear Regression - Estimated Regression Equation |
| TimeRFC[t] = + 18668.3206607017 + 649.982998349128`#Logins`[t] + 0.308510559348594`#characters`[t] -0.985316356526397`#revisions`[t] + 1.50553568456771`#seconds`[t] + 1041.59586653222`#Hyperlinks`[t] -1430.90950241908`#Blogs`[t] + e[t] |
| Multiple Linear Regression - Ordinary Least Squares | |||||
| Variable | Parameter | S.D. | T-STAT H0: parameter = 0 | 2-tail p-value | 1-tail p-value |
| (Intercept) | 18668.3206607017 | 5369.045766 | 3.477 | 0.001482 | 0.000741 |
| `#Logins` | 649.982998349128 | 183.48794 | 3.5424 | 0.001242 | 0.000621 |
| `#characters` | 0.308510559348594 | 0.177682 | 1.7363 | 0.092129 | 0.046065 |
| `#revisions` | -0.985316356526397 | 1.658625 | -0.5941 | 0.556651 | 0.278326 |
| `#seconds` | 1.50553568456771 | 0.382076 | 3.9404 | 0.000414 | 0.000207 |
| `#Hyperlinks` | 1041.59586653222 | 1861.852949 | 0.5594 | 0.579756 | 0.289878 |
| `#Blogs` | -1430.90950241908 | 1819.271139 | -0.7865 | 0.437344 | 0.218672 |
| Multiple Linear Regression - Regression Statistics | |
| Multiple R | 0.89781439719386 |
| R-squared | 0.806070691808575 |
| Adjusted R-squared | 0.769708946522682 |
| F-TEST (value) | 22.1680968685878 |
| F-TEST (DF numerator) | 6 |
| F-TEST (DF denominator) | 32 |
| p-value | 4.0927405908775e-10 |
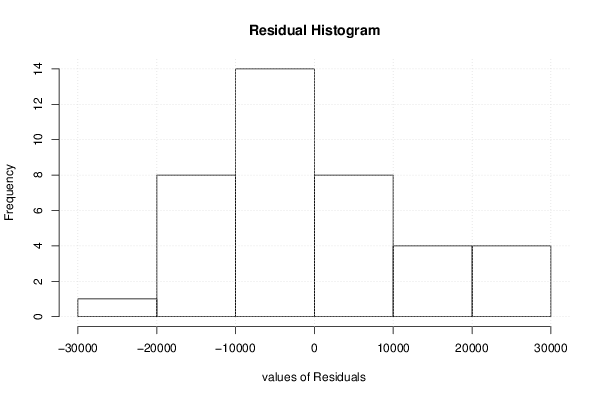
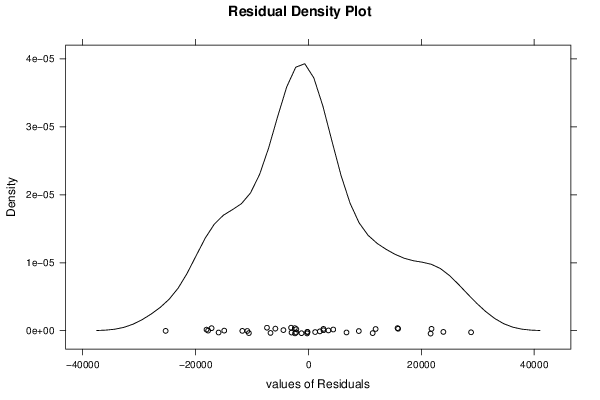
| Multiple Linear Regression - Residual Statistics | |
| Residual Standard Deviation | 13585.5459703615 |
| Sum Squared Residuals | 5906145898.00978 |
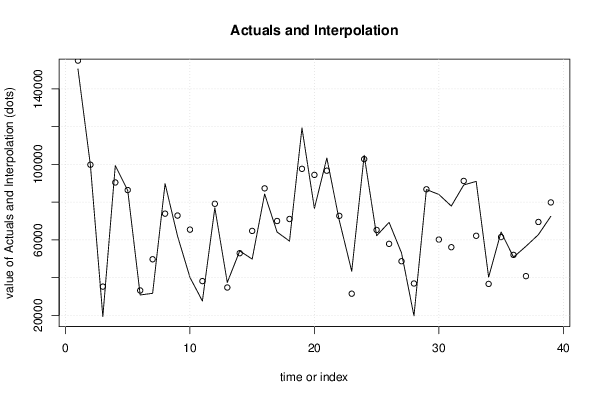
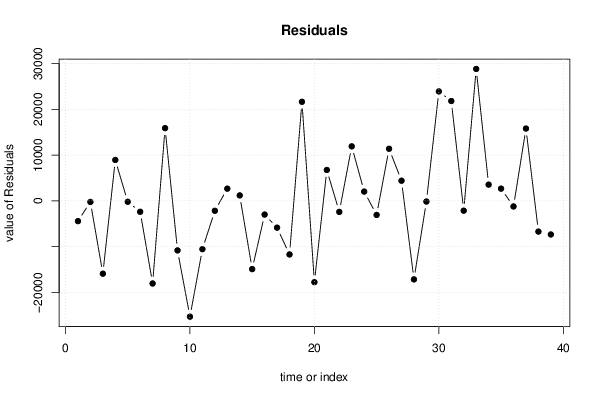
| Multiple Linear Regression - Actuals, Interpolation, and Residuals | |||
| Time or Index | Actuals | Interpolation Forecast | Residuals Prediction Error |
| 1 | 150580 | 155005.2903637 | -4425.29036370035 |
| 2 | 99611 | 99842.3379552135 | -231.337955213549 |
| 3 | 19349 | 35254.0974271473 | -15905.0974271473 |
| 4 | 99373 | 90437.4595228677 | 8935.54047713226 |
| 5 | 86230 | 86424.6341776099 | -194.634177609898 |
| 6 | 30837 | 33214.0202125339 | -2377.02021253387 |
| 7 | 31706 | 49752.5068668598 | -18046.5068668598 |
| 8 | 89806 | 73914.0487984756 | 15891.9512015244 |
| 9 | 62088 | 72908.7203554497 | -10820.7203554497 |
| 10 | 40151 | 65442.2507607823 | -25291.2507607823 |
| 11 | 27634 | 38176.8519487621 | -10542.8519487621 |
| 12 | 76990 | 79153.0921000158 | -2163.09210001575 |
| 13 | 37460 | 34790.812532193 | 2669.18746780701 |
| 14 | 54157 | 52963.568687646 | 1193.43131235398 |
| 15 | 49862 | 64769.3259676339 | -14907.3259676339 |
| 16 | 84337 | 87323.9314437573 | -2986.93144375727 |
| 17 | 64175 | 70024.5027636747 | -5849.50276367467 |
| 18 | 59382 | 71086.4925913806 | -11704.4925913806 |
| 19 | 119308 | 97660.5467678277 | 21647.4532321723 |
| 20 | 76702 | 94462.3326423823 | -17760.3326423823 |
| 21 | 103425 | 96675.1966049766 | 6749.80339502336 |
| 22 | 70344 | 72748.5533253434 | -2404.55332534338 |
| 23 | 43410 | 31502.28255747 | 11907.71744253 |
| 24 | 104838 | 102804.731037786 | 2033.2689622141 |
| 25 | 62215 | 65282.1838167494 | -3067.18381674941 |
| 26 | 69304 | 57919.0242076946 | 11384.9757923054 |
| 27 | 53117 | 48713.2420297823 | 4403.75797021772 |
| 28 | 19764 | 36914.4614427316 | -17150.4614427316 |
| 29 | 86680 | 86823.5220804189 | -143.522080418909 |
| 30 | 84105 | 60192.7398759041 | 23912.2601240959 |
| 31 | 77945 | 56131.2995214753 | 21813.7004785247 |
| 32 | 89113 | 91252.0180407 | -2139.01804070001 |
| 33 | 91005 | 62186.4006558396 | 28818.5993441604 |
| 34 | 40248 | 36699.3586633734 | 3548.6413366266 |
| 35 | 64187 | 61515.3770694137 | 2671.62293058632 |
| 36 | 50857 | 52077.4014866581 | -1220.40148665805 |
| 37 | 56613 | 40814.6378893428 | 15798.3621106572 |
| 38 | 62792 | 69502.7995761279 | -6710.79957612786 |
| 39 | 72535 | 79872.9462322992 | -7337.94623229924 |
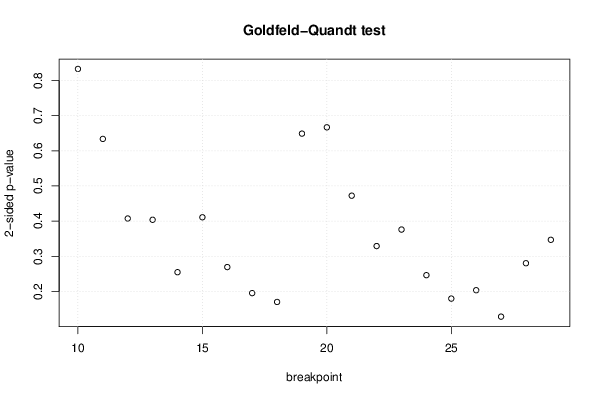
| Goldfeld-Quandt test for Heteroskedasticity | |||
| p-values | Alternative Hypothesis | ||
| breakpoint index | greater | 2-sided | less |
| 10 | 0.416407221339155 | 0.832814442678311 | 0.583592778660845 |
| 11 | 0.31690259710667 | 0.633805194213339 | 0.683097402893331 |
| 12 | 0.203691392901885 | 0.407382785803771 | 0.796308607098115 |
| 13 | 0.201905911460156 | 0.403811822920313 | 0.798094088539844 |
| 14 | 0.127327200453763 | 0.254654400907525 | 0.872672799546237 |
| 15 | 0.205435753129501 | 0.410871506259002 | 0.794564246870499 |
| 16 | 0.134618997168053 | 0.269237994336105 | 0.865381002831947 |
| 17 | 0.0975556737013218 | 0.195111347402644 | 0.902444326298678 |
| 18 | 0.085004314268886 | 0.170008628537772 | 0.914995685731114 |
| 19 | 0.324425168900158 | 0.648850337800316 | 0.675574831099842 |
| 20 | 0.333390638072277 | 0.666781276144554 | 0.666609361927723 |
| 21 | 0.236151450455677 | 0.472302900911353 | 0.763848549544323 |
| 22 | 0.164485508257484 | 0.328971016514968 | 0.835514491742516 |
| 23 | 0.18798965124016 | 0.37597930248032 | 0.81201034875984 |
| 24 | 0.123113156527188 | 0.246226313054377 | 0.876886843472812 |
| 25 | 0.0897921867842211 | 0.179584373568442 | 0.910207813215779 |
| 26 | 0.101700095222268 | 0.203400190444537 | 0.898299904777732 |
| 27 | 0.0641141778557994 | 0.128228355711599 | 0.935885822144201 |
| 28 | 0.140091926632595 | 0.280183853265191 | 0.859908073367404 |
| 29 | 0.173413178807788 | 0.346826357615576 | 0.826586821192212 |
| Meta Analysis of Goldfeld-Quandt test for Heteroskedasticity | |||
| Description | # significant tests | % significant tests | OK/NOK |
| 1% type I error level | 0 | 0 | OK |
| 5% type I error level | 0 | 0 | OK |
| 10% type I error level | 0 | 0 | OK |