| Multiple Linear Regression - Estimated Regression Equation |
| werkeloosheid[t] = + 336.949180150454 + 0.736472661110573onderwijshoog[t] + 1.76602209451291onderwijsmiddelbaar[t] + 0.102367884585266onderwijslaag[t] -0.0111015113268626autochtoon[t] + 0.0445219197107632allochtonen[t] -0.0319311171143291banen[t] -0.0755745369985274vacatures[t] + e[t] |
| Multiple Linear Regression - Ordinary Least Squares | |||||
| Variable | Parameter | S.D. | T-STAT H0: parameter = 0 | 2-tail p-value | 1-tail p-value |
| (Intercept) | 336.949180150454 | 63.772687 | 5.2836 | 3e-06 | 2e-06 |
| onderwijshoog | 0.736472661110573 | 0.215405 | 3.419 | 0.001291 | 0.000645 |
| onderwijsmiddelbaar | 1.76602209451291 | 0.115506 | 15.2895 | 0 | 0 |
| onderwijslaag | 0.102367884585266 | 0.158366 | 0.6464 | 0.521098 | 0.260549 |
| autochtoon | -0.0111015113268626 | 0.10456 | -0.1062 | 0.915887 | 0.457943 |
| allochtonen | 0.0445219197107632 | 0.125678 | 0.3543 | 0.7247 | 0.36235 |
| banen | -0.0319311171143291 | 0.007018 | -4.55 | 3.7e-05 | 1.8e-05 |
| vacatures | -0.0755745369985274 | 0.038562 | -1.9598 | 0.055835 | 0.027918 |
| Multiple Linear Regression - Regression Statistics | |
| Multiple R | 0.994306693815321 |
| R-squared | 0.988645801365954 |
| Adjusted R-squared | 0.986989980731822 |
| F-TEST (value) | 597.073004760793 |
| F-TEST (DF numerator) | 7 |
| F-TEST (DF denominator) | 48 |
| p-value | 0 |
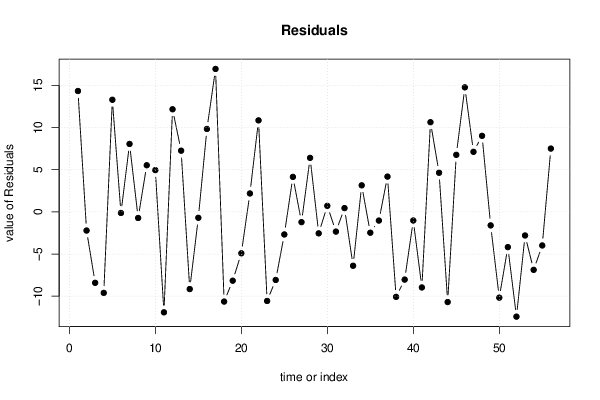
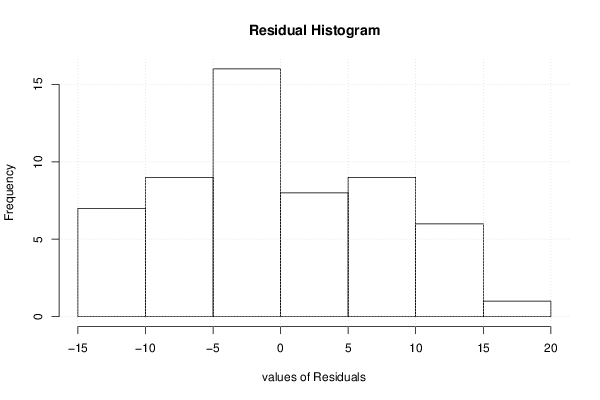
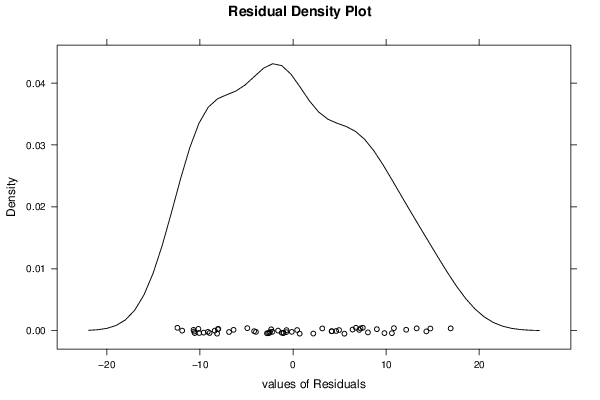
| Multiple Linear Regression - Residual Statistics | |
| Residual Standard Deviation | 8.46070052981864 |
| Sum Squared Residuals | 3436.00576585313 |
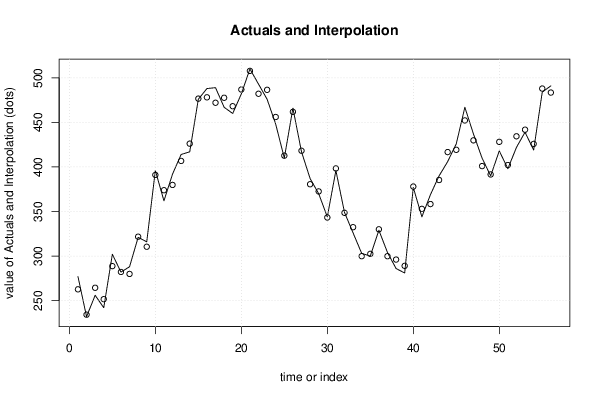
| Multiple Linear Regression - Actuals, Interpolation, and Residuals | |||
| Time or Index | Actuals | Interpolation Forecast | Residuals Prediction Error |
| 1 | 277 | 262.671173282517 | 14.3288267174835 |
| 2 | 232 | 234.216947143084 | -2.216947143084 |
| 3 | 256 | 264.414425306019 | -8.41442530601893 |
| 4 | 242 | 251.607663097246 | -9.6076630972456 |
| 5 | 302 | 288.710306783772 | 13.2896932162279 |
| 6 | 282 | 282.133672738722 | -0.133672738721927 |
| 7 | 288 | 279.947499458013 | 8.05250054198733 |
| 8 | 321 | 321.726923751628 | -0.726923751627706 |
| 9 | 316 | 310.475572008146 | 5.52442799185441 |
| 10 | 396 | 391.054718800802 | 4.94528119919807 |
| 11 | 362 | 373.913726409347 | -11.9137264093474 |
| 12 | 392 | 379.838087590152 | 12.1619124098483 |
| 13 | 414 | 406.74683369657 | 7.25316630343043 |
| 14 | 417 | 426.155317070184 | -9.15531707018438 |
| 15 | 476 | 476.702934538316 | -0.702934538316347 |
| 16 | 488 | 478.173490341117 | 9.82650965888271 |
| 17 | 489 | 472.05705424605 | 16.9429457539504 |
| 18 | 467 | 477.639882947714 | -10.6398829477138 |
| 19 | 460 | 468.164841295283 | -8.16484129528346 |
| 20 | 482 | 486.912483152844 | -4.9124831528441 |
| 21 | 510 | 507.819772614784 | 2.18022738521592 |
| 22 | 493 | 482.154796303041 | 10.8452036969591 |
| 23 | 476 | 486.567289075646 | -10.5672890756458 |
| 24 | 448 | 456.077347138291 | -8.0773471382906 |
| 25 | 410 | 412.682238662241 | -2.68223866224131 |
| 26 | 466 | 461.856756615279 | 4.14324338472146 |
| 27 | 417 | 418.220837407705 | -1.22083740770498 |
| 28 | 387 | 380.602074867249 | 6.39792513275125 |
| 29 | 370 | 372.549708117529 | -2.54970811752872 |
| 30 | 344 | 343.287440973298 | 0.712559026702197 |
| 31 | 396 | 398.34310014283 | -2.34310014282975 |
| 32 | 349 | 348.558837163192 | 0.441162836807647 |
| 33 | 326 | 332.392011511122 | -6.39201151112188 |
| 34 | 303 | 299.857345728526 | 3.14265427147443 |
| 35 | 300 | 302.474704214896 | -2.47470421489565 |
| 36 | 329 | 330.035219005775 | -1.03521900577517 |
| 37 | 304 | 299.820564217161 | 4.17943578283875 |
| 38 | 286 | 296.079983996019 | -10.0799839960194 |
| 39 | 281 | 289.030818993534 | -8.03081899353386 |
| 40 | 377 | 378.025829956105 | -1.02582995610506 |
| 41 | 344 | 352.96530568811 | -8.96530568811045 |
| 42 | 369 | 358.371913305216 | 10.6280866947836 |
| 43 | 390 | 385.366118108229 | 4.63388189177148 |
| 44 | 406 | 416.694937824331 | -10.694937824331 |
| 45 | 426 | 419.238107643468 | 6.76189235653238 |
| 46 | 467 | 452.239780382177 | 14.760219617823 |
| 47 | 437 | 429.882934392085 | 7.11706560791477 |
| 48 | 410 | 400.987698470054 | 9.01230152994613 |
| 49 | 390 | 391.607044701927 | -1.60704470192719 |
| 50 | 418 | 428.173345414142 | -10.1733454141417 |
| 51 | 398 | 402.182631374534 | -4.18263137453356 |
| 52 | 422 | 434.426680667794 | -12.426680667794 |
| 53 | 439 | 441.802676984208 | -2.8026769842076 |
| 54 | 419 | 425.87770218013 | -6.87770218013029 |
| 55 | 484 | 487.985446536424 | -3.98544653642443 |
| 56 | 491 | 483.497445965425 | 7.50255403457484 |
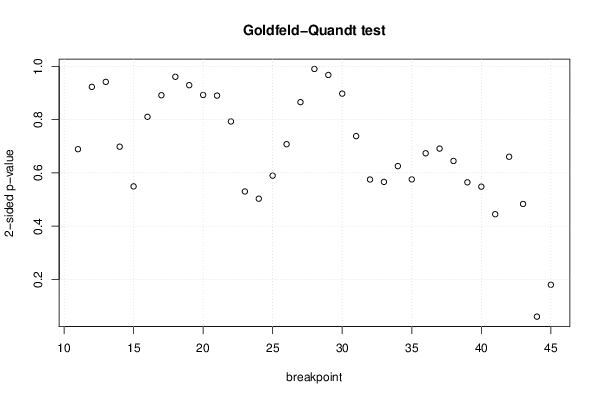
| Goldfeld-Quandt test for Heteroskedasticity | |||
| p-values | Alternative Hypothesis | ||
| breakpoint index | greater | 2-sided | less |
| 11 | 0.655480953660927 | 0.689038092678146 | 0.344519046339073 |
| 12 | 0.538593391294953 | 0.922813217410094 | 0.461406608705047 |
| 13 | 0.470790457038259 | 0.941580914076518 | 0.529209542961741 |
| 14 | 0.349152564432776 | 0.698305128865553 | 0.650847435567224 |
| 15 | 0.274731886691972 | 0.549463773383944 | 0.725268113308028 |
| 16 | 0.40520207286228 | 0.810404145724559 | 0.59479792713772 |
| 17 | 0.554295302830671 | 0.891409394338657 | 0.445704697169329 |
| 18 | 0.519683697949062 | 0.960632604101877 | 0.480316302050938 |
| 19 | 0.464588830461491 | 0.929177660922982 | 0.535411169538509 |
| 20 | 0.553774708842927 | 0.892450582314145 | 0.446225291157073 |
| 21 | 0.554997199634176 | 0.890005600731648 | 0.445002800365824 |
| 22 | 0.603536730066205 | 0.79292653986759 | 0.396463269933795 |
| 23 | 0.734792435311959 | 0.530415129376082 | 0.265207564688041 |
| 24 | 0.748399838541359 | 0.503200322917282 | 0.251600161458641 |
| 25 | 0.705179211119624 | 0.589641577760752 | 0.294820788880376 |
| 26 | 0.646198203478661 | 0.707603593042678 | 0.353801796521339 |
| 27 | 0.567273815431173 | 0.865452369137655 | 0.432726184568827 |
| 28 | 0.504964841037909 | 0.990070317924182 | 0.495035158962091 |
| 29 | 0.516232947665202 | 0.967534104669597 | 0.483767052334798 |
| 30 | 0.448743813500978 | 0.897487627001957 | 0.551256186499022 |
| 31 | 0.369000953067802 | 0.738001906135603 | 0.630999046932198 |
| 32 | 0.287627870459322 | 0.575255740918644 | 0.712372129540678 |
| 33 | 0.283135417716727 | 0.566270835433453 | 0.716864582283273 |
| 34 | 0.312750703001804 | 0.625501406003607 | 0.687249296998196 |
| 35 | 0.287851754450321 | 0.575703508900642 | 0.712148245549679 |
| 36 | 0.33680341885272 | 0.67360683770544 | 0.66319658114728 |
| 37 | 0.345601313207591 | 0.691202626415182 | 0.654398686792409 |
| 38 | 0.32240685029278 | 0.64481370058556 | 0.67759314970722 |
| 39 | 0.282326077867036 | 0.564652155734072 | 0.717673922132964 |
| 40 | 0.274171042472321 | 0.548342084944641 | 0.72582895752768 |
| 41 | 0.222518606811262 | 0.445037213622525 | 0.777481393188738 |
| 42 | 0.330318051562969 | 0.660636103125938 | 0.669681948437031 |
| 43 | 0.758275968135113 | 0.483448063729774 | 0.241724031864887 |
| 44 | 0.96964920207174 | 0.0607015958565193 | 0.0303507979282596 |
| 45 | 0.909881230478297 | 0.180237539043406 | 0.0901187695217032 |
| Meta Analysis of Goldfeld-Quandt test for Heteroskedasticity | |||
| Description | # significant tests | % significant tests | OK/NOK |
| 1% type I error level | 0 | 0 | OK |
| 5% type I error level | 0 | 0 | OK |
| 10% type I error level | 1 | 0.0285714285714286 | OK |