| Multiple Linear Regression - Estimated Regression Equation |
| werkeloosheid[t] = + 345.737281811736 + 0.779541993504779onderwijshoog[t] + 1.74114776568342onderwijsmiddelbaar[t] + 0.0839055946028946onderwijslaag[t] -0.0106306368341571autochtoon[t] + 0.0537912529222352allochtonen[t] -0.0329443072826697banen[t] -0.0756563545592138vacatures[t] + 0.00355270890608731faillietevenootschappen[t] + e[t] |
| Multiple Linear Regression - Ordinary Least Squares | |||||
| Variable | Parameter | S.D. | T-STAT H0: parameter = 0 | 2-tail p-value | 1-tail p-value |
| (Intercept) | 345.737281811736 | 67.341367 | 5.1341 | 5e-06 | 3e-06 |
| onderwijshoog | 0.779541993504779 | 0.238247 | 3.272 | 0.002005 | 0.001003 |
| onderwijsmiddelbaar | 1.74114776568342 | 0.129466 | 13.4487 | 0 | 0 |
| onderwijslaag | 0.0839055946028946 | 0.165126 | 0.5081 | 0.613738 | 0.306869 |
| autochtoon | -0.0106306368341571 | 0.105454 | -0.1008 | 0.920132 | 0.460066 |
| allochtonen | 0.0537912529222352 | 0.128484 | 0.4187 | 0.67737 | 0.338685 |
| banen | -0.0329443072826697 | 0.007442 | -4.4266 | 5.7e-05 | 2.8e-05 |
| vacatures | -0.0756563545592138 | 0.03889 | -1.9454 | 0.057723 | 0.028862 |
| faillietevenootschappen | 0.00355270890608731 | 0.008069 | 0.4403 | 0.661761 | 0.33088 |
| Multiple Linear Regression - Regression Statistics | |
| Multiple R | 0.994330144262836 |
| R-squared | 0.988692435789752 |
| Adjusted R-squared | 0.986767744009284 |
| F-TEST (value) | 513.688708926405 |
| F-TEST (DF numerator) | 8 |
| F-TEST (DF denominator) | 47 |
| p-value | 0 |
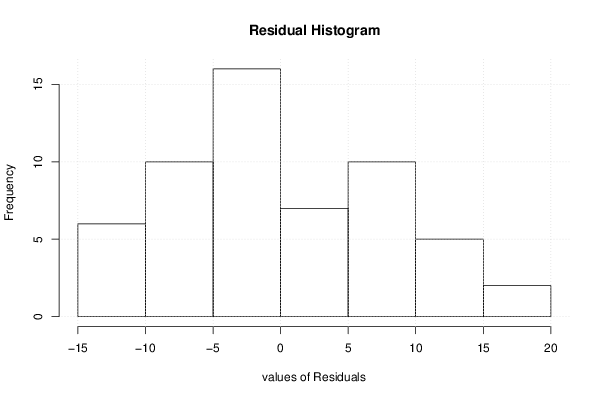
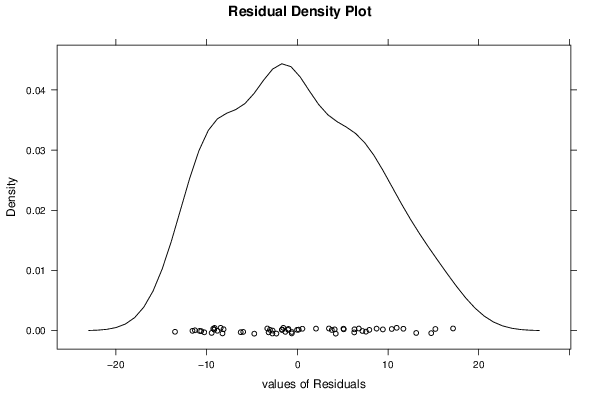
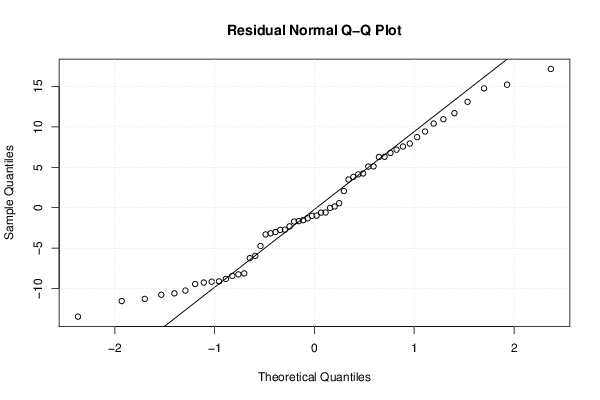
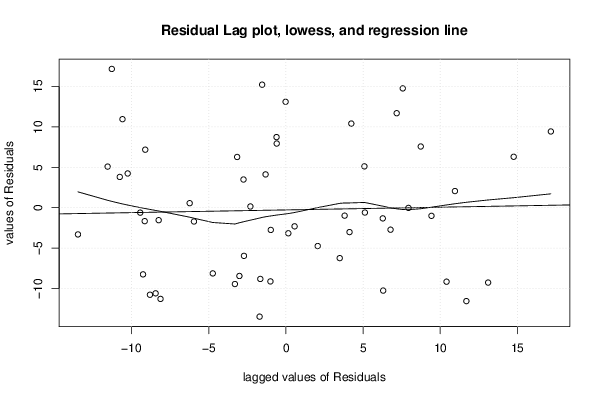
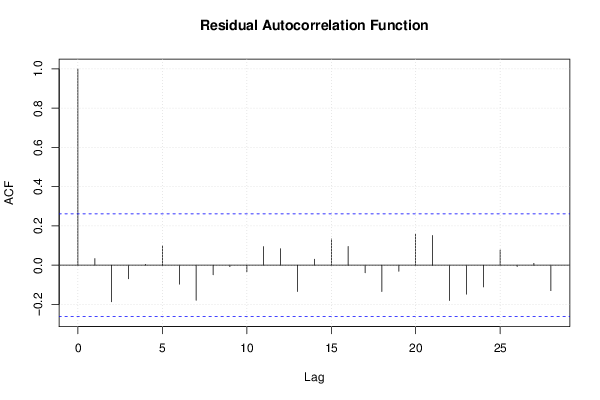
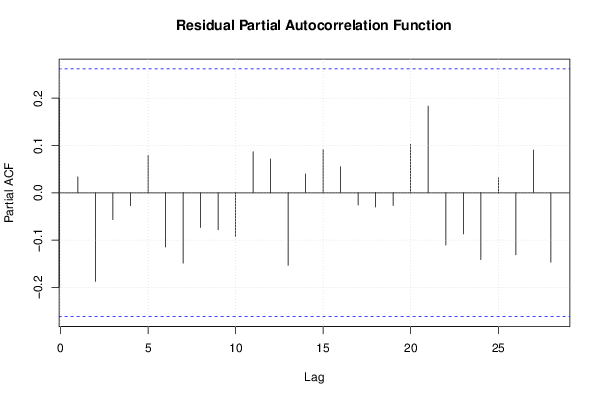
| Multiple Linear Regression - Residual Statistics | |
| Residual Standard Deviation | 8.53265724495959 |
| Sum Squared Residuals | 3421.89326401819 |
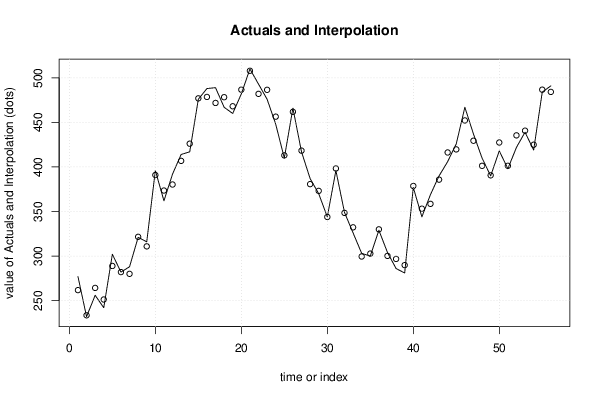
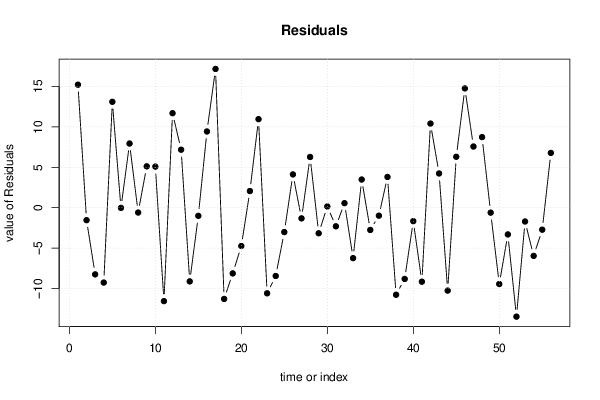
| Multiple Linear Regression - Actuals, Interpolation, and Residuals | |||
| Time or Index | Actuals | Interpolation Forecast | Residuals Prediction Error |
| 1 | 277 | 261.779332949706 | 15.2206670502938 |
| 2 | 232 | 233.541908625068 | -1.54190862506847 |
| 3 | 256 | 264.247044324266 | -8.24704432426553 |
| 4 | 242 | 251.259918487366 | -9.25991848736553 |
| 5 | 302 | 288.895145117484 | 13.104854882516 |
| 6 | 282 | 282.022460971758 | -0.0224609717582293 |
| 7 | 288 | 280.05908327889 | 7.94091672110976 |
| 8 | 321 | 321.596146769462 | -0.596146769461985 |
| 9 | 316 | 310.882756608621 | 5.11724339137896 |
| 10 | 396 | 390.913552850036 | 5.08644714996365 |
| 11 | 362 | 373.554640665341 | -11.5546406653409 |
| 12 | 392 | 380.305696543701 | 11.6943034562988 |
| 13 | 414 | 406.821594835011 | 7.17840516498924 |
| 14 | 417 | 426.117353643691 | -9.11735364369138 |
| 15 | 476 | 477.004161810398 | -1.0041618103976 |
| 16 | 488 | 478.568272219109 | 9.43172778089139 |
| 17 | 489 | 471.831267074444 | 17.1687329255561 |
| 18 | 467 | 478.284120381431 | -11.2841203814305 |
| 19 | 460 | 468.127409718941 | -8.12740971894077 |
| 20 | 482 | 486.739820965378 | -4.73982096537754 |
| 21 | 510 | 507.938484278546 | 2.06151572145395 |
| 22 | 493 | 482.046184980338 | 10.9538150196621 |
| 23 | 476 | 486.591683279082 | -10.5916832790819 |
| 24 | 448 | 456.44562150658 | -8.44562150657954 |
| 25 | 410 | 413.014718703914 | -3.01471870391404 |
| 26 | 466 | 461.878726971676 | 4.12127302832443 |
| 27 | 417 | 418.319238299639 | -1.31923829963871 |
| 28 | 387 | 380.723420829454 | 6.2765791705464 |
| 29 | 370 | 373.161774431548 | -3.16177443154756 |
| 30 | 344 | 343.846537522113 | 0.153462477887228 |
| 31 | 396 | 398.303440896684 | -2.30344089668394 |
| 32 | 349 | 348.439183655121 | 0.56081634487856 |
| 33 | 326 | 332.236893709247 | -6.23689370924688 |
| 34 | 303 | 299.511998954741 | 3.48800104525929 |
| 35 | 300 | 302.749977158541 | -2.74997715854072 |
| 36 | 329 | 329.981652442875 | -0.981652442875325 |
| 37 | 304 | 300.19507261933 | 3.80492738067022 |
| 38 | 286 | 296.767687168185 | -10.7676871681855 |
| 39 | 281 | 289.811072100899 | -8.81107210089851 |
| 40 | 377 | 378.660391090672 | -1.66039109067166 |
| 41 | 344 | 353.151757609367 | -9.15175760936678 |
| 42 | 369 | 358.590942069613 | 10.4090579303865 |
| 43 | 390 | 385.763073846711 | 4.23692615328861 |
| 44 | 406 | 416.25346560836 | -10.2534656083596 |
| 45 | 426 | 419.696450170056 | 6.30354982994416 |
| 46 | 467 | 452.238273417953 | 14.7617265820474 |
| 47 | 437 | 429.429065017324 | 7.57093498267586 |
| 48 | 410 | 401.262896644344 | 8.73710335565579 |
| 49 | 390 | 390.609129706732 | -0.609129706732383 |
| 50 | 418 | 427.44235633683 | -9.44235633683043 |
| 51 | 398 | 401.305528804024 | -3.30552880402391 |
| 52 | 422 | 435.477666249389 | -13.4776662493886 |
| 53 | 439 | 440.705770149015 | -1.70577014901535 |
| 54 | 419 | 424.959395290134 | -5.95939529013381 |
| 55 | 484 | 486.718564366494 | -2.71856436649423 |
| 56 | 491 | 484.22021627437 | 6.77978372562973 |
| Goldfeld-Quandt test for Heteroskedasticity | |||
| p-values | Alternative Hypothesis | ||
| breakpoint index | greater | 2-sided | less |
| 12 | 0.637413499966062 | 0.725173000067877 | 0.362586500033938 |
| 13 | 0.572899598861745 | 0.85420080227651 | 0.427100401138255 |
| 14 | 0.433929703161269 | 0.867859406322537 | 0.566070296838731 |
| 15 | 0.343660585402331 | 0.687321170804661 | 0.65633941459767 |
| 16 | 0.4269828641928 | 0.8539657283856 | 0.5730171358072 |
| 17 | 0.600262747763916 | 0.799474504472169 | 0.399737252236085 |
| 18 | 0.5860850715853 | 0.827829856829401 | 0.4139149284147 |
| 19 | 0.524866581823459 | 0.950266836353083 | 0.475133418176541 |
| 20 | 0.619563102214001 | 0.760873795571998 | 0.380436897785999 |
| 21 | 0.58441249177512 | 0.83117501644976 | 0.41558750822488 |
| 22 | 0.641910984326213 | 0.716178031347574 | 0.358089015673787 |
| 23 | 0.767718787851772 | 0.464562424296457 | 0.232281212148228 |
| 24 | 0.787151503426703 | 0.425696993146593 | 0.212848496573297 |
| 25 | 0.750984318279298 | 0.498031363441404 | 0.249015681720702 |
| 26 | 0.688930942277976 | 0.622138115444047 | 0.311069057722024 |
| 27 | 0.61156258943055 | 0.7768748211389 | 0.38843741056945 |
| 28 | 0.545608123590806 | 0.908783752818387 | 0.454391876409194 |
| 29 | 0.519112499511987 | 0.961775000976026 | 0.480887500488013 |
| 30 | 0.438753418764917 | 0.877506837529835 | 0.561246581235083 |
| 31 | 0.37177758143165 | 0.743555162863299 | 0.62822241856835 |
| 32 | 0.295277970835351 | 0.590555941670703 | 0.704722029164649 |
| 33 | 0.331256890328199 | 0.662513780656398 | 0.668743109671801 |
| 34 | 0.313507015430982 | 0.627014030861965 | 0.686492984569018 |
| 35 | 0.282681079833744 | 0.565362159667489 | 0.717318920166256 |
| 36 | 0.36694526939764 | 0.733890538795281 | 0.63305473060236 |
| 37 | 0.348588543784104 | 0.697177087568208 | 0.651411456215896 |
| 38 | 0.312608671313623 | 0.625217342627246 | 0.687391328686377 |
| 39 | 0.253672628336439 | 0.507345256672879 | 0.746327371663561 |
| 40 | 0.226809915188166 | 0.453619830376332 | 0.773190084811834 |
| 41 | 0.220068520656992 | 0.440137041313985 | 0.779931479343008 |
| 42 | 0.249064406326476 | 0.498128812652951 | 0.750935593673524 |
| 43 | 0.841543925891967 | 0.316912148216067 | 0.158456074108033 |
| 44 | 0.912680587983104 | 0.174638824033792 | 0.0873194120168961 |
| Meta Analysis of Goldfeld-Quandt test for Heteroskedasticity | |||
| Description | # significant tests | % significant tests | OK/NOK |
| 1% type I error level | 0 | 0 | OK |
| 5% type I error level | 0 | 0 | OK |
| 10% type I error level | 0 | 0 | OK |