| Multiple Linear Regression - Estimated Regression Equation |
| yt[t] = + 3.45629811619316 + 0.196161753058943x2t[t] -0.0759301670223675x3t[t] -0.113069511933674x4t[t] + 0.0478247101671386x5t[t] + 0.139243237474657x6t[t] -0.0750676981882023x7t[t] + 0.267814648345915`x8t\r`[t] + e[t] |
| Multiple Linear Regression - Ordinary Least Squares | |||||
| Variable | Parameter | S.D. | T-STAT H0: parameter = 0 | 2-tail p-value | 1-tail p-value |
| (Intercept) | 3.45629811619316 | 2.178667 | 1.5864 | 0.118591 | 0.059296 |
| x2t | 0.196161753058943 | 0.132418 | 1.4814 | 0.144427 | 0.072214 |
| x3t | -0.0759301670223675 | 0.13247 | -0.5732 | 0.568942 | 0.284471 |
| x4t | -0.113069511933674 | 0.134229 | -0.8424 | 0.403369 | 0.201684 |
| x5t | 0.0478247101671386 | 0.13037 | 0.3668 | 0.7152 | 0.3576 |
| x6t | 0.139243237474657 | 0.136731 | 1.0184 | 0.313125 | 0.156563 |
| x7t | -0.0750676981882023 | 0.121729 | -0.6167 | 0.540086 | 0.270043 |
| `x8t\r` | 0.267814648345915 | 0.150226 | 1.7827 | 0.080355 | 0.040178 |
| Multiple Linear Regression - Regression Statistics | |
| Multiple R | 0.364556124942623 |
| R-squared | 0.132901168233181 |
| Adjusted R-squared | 0.0183786810186957 |
| F-TEST (value) | 1.16048098033598 |
| F-TEST (DF numerator) | 7 |
| F-TEST (DF denominator) | 53 |
| p-value | 0.341012012633835 |
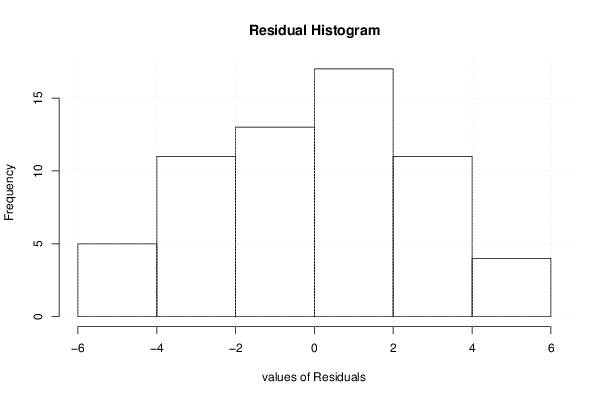
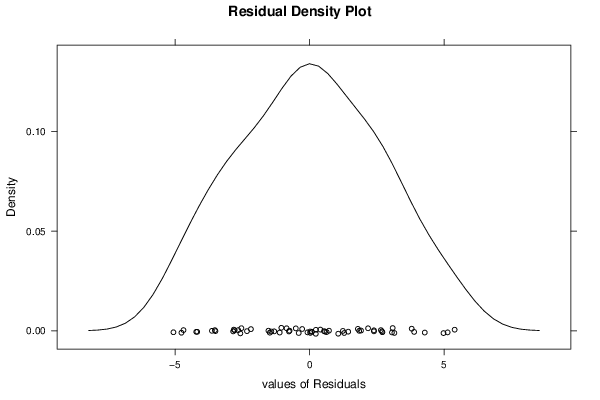
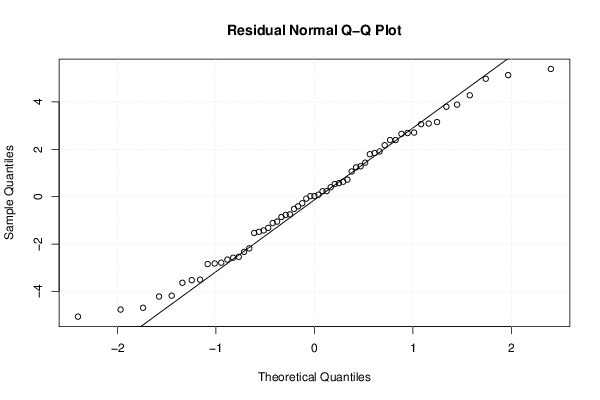
| Multiple Linear Regression - Residual Statistics | |
| Residual Standard Deviation | 2.82490682301822 |
| Sum Squared Residuals | 422.94522361295 |
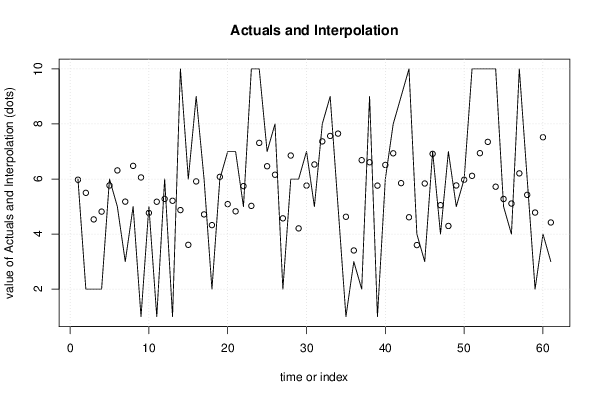
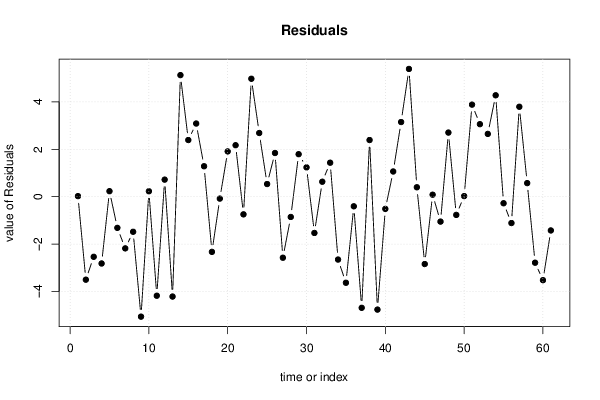
| Multiple Linear Regression - Actuals, Interpolation, and Residuals | |||
| Time or Index | Actuals | Interpolation Forecast | Residuals Prediction Error |
| 1 | 6 | 5.97451927755216 | 0.0254807224478388 |
| 2 | 2 | 5.49857712841829 | -3.49857712841829 |
| 3 | 2 | 4.53389069210628 | -2.53389069210628 |
| 4 | 2 | 4.81601249412711 | -2.81601249412711 |
| 5 | 6 | 5.76679038899944 | 0.233209611000556 |
| 6 | 5 | 6.31348169106502 | -1.31348169106502 |
| 7 | 3 | 5.17871330610304 | -2.17871330610304 |
| 8 | 5 | 6.4782217562291 | -1.4782217562291 |
| 9 | 1 | 6.05817446193647 | -5.05817446193647 |
| 10 | 5 | 4.7695259540841 | 0.230474045915896 |
| 11 | 1 | 5.1751802299306 | -4.1751802299306 |
| 12 | 6 | 5.27884615787414 | 0.721153842125858 |
| 13 | 1 | 5.21044601781996 | -4.21044601781996 |
| 14 | 10 | 4.87142088630761 | 5.12857911369239 |
| 15 | 6 | 3.60919439484707 | 2.39080560515293 |
| 16 | 9 | 5.91354406983396 | 3.08645593016604 |
| 17 | 6 | 4.71472469168929 | 1.28527530831071 |
| 18 | 2 | 4.32657988990027 | -2.32657988990027 |
| 19 | 6 | 6.07889527555615 | -0.0788952755561467 |
| 20 | 7 | 5.08886987387357 | 1.91113012612643 |
| 21 | 7 | 4.82736705851445 | 2.17263294148555 |
| 22 | 5 | 5.74416285465818 | -0.744162854658176 |
| 23 | 10 | 5.02500803721423 | 4.97499196278577 |
| 24 | 10 | 7.31270875951263 | 2.68729124048737 |
| 25 | 7 | 6.4649339603068 | 0.535066039693197 |
| 26 | 8 | 6.15599651356917 | 1.84400348643083 |
| 27 | 2 | 4.57275850318856 | -2.57275850318856 |
| 28 | 6 | 6.85408815819095 | -0.854088158190954 |
| 29 | 6 | 4.20677006344886 | 1.79322993655114 |
| 30 | 7 | 5.76267526056093 | 1.23732473943907 |
| 31 | 5 | 6.52845046861006 | -1.52845046861006 |
| 32 | 8 | 7.36739786487237 | 0.632602135127633 |
| 33 | 9 | 7.56485657389582 | 1.43514342610418 |
| 34 | 5 | 7.65034921413682 | -2.65034921413682 |
| 35 | 1 | 4.62896234766838 | -3.62896234766838 |
| 36 | 3 | 3.40446460431721 | -0.404464604317205 |
| 37 | 2 | 6.68513863815468 | -4.68513863815468 |
| 38 | 9 | 6.60953754344057 | 2.39046245655943 |
| 39 | 1 | 5.76050573775431 | -4.76050573775431 |
| 40 | 6 | 6.51248979277303 | -0.512489792773028 |
| 41 | 8 | 6.93566322139097 | 1.06433677860903 |
| 42 | 9 | 5.85049764024829 | 3.14950235975172 |
| 43 | 10 | 4.61116128701828 | 5.38883871298172 |
| 44 | 4 | 3.60103994466798 | 0.398960055332021 |
| 45 | 3 | 5.83870009993629 | -2.83870009993629 |
| 46 | 7 | 6.91518564011642 | 0.0848143598835802 |
| 47 | 4 | 5.0491240358304 | -1.0491240358304 |
| 48 | 7 | 4.29487797337898 | 2.70512202662102 |
| 49 | 5 | 5.76697406162425 | -0.766974061624246 |
| 50 | 6 | 5.97372686873931 | 0.0262731312606854 |
| 51 | 10 | 6.11571140912457 | 3.88428859087543 |
| 52 | 10 | 6.94008280021596 | 3.05991719978404 |
| 53 | 10 | 7.35027549683558 | 2.64972450316442 |
| 54 | 10 | 5.72120279668705 | 4.27879720331295 |
| 55 | 5 | 5.27545692314765 | -0.275456923147651 |
| 56 | 4 | 5.11021751681981 | -1.11021751681981 |
| 57 | 10 | 6.20595782298186 | 3.79404217701814 |
| 58 | 6 | 5.42598965941525 | 0.574010340584749 |
| 59 | 2 | 4.78257836992476 | -2.78257836992476 |
| 60 | 4 | 7.51887105944073 | -3.51887105944072 |
| 61 | 3 | 4.42247477941398 | -1.42247477941398 |
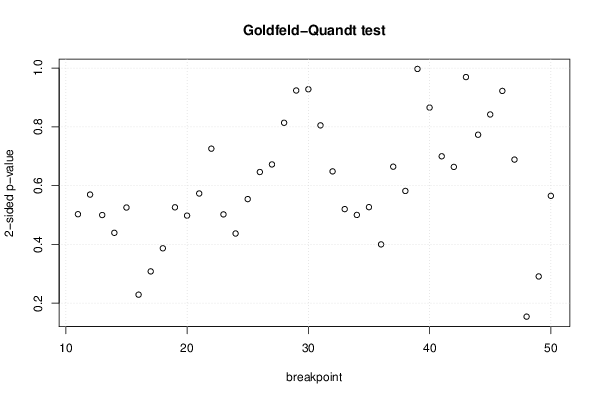
| Goldfeld-Quandt test for Heteroskedasticity | |||
| p-values | Alternative Hypothesis | ||
| breakpoint index | greater | 2-sided | less |
| 11 | 0.2514255922502 | 0.5028511845004 | 0.7485744077498 |
| 12 | 0.284825566910268 | 0.569651133820537 | 0.715174433089732 |
| 13 | 0.250028711838761 | 0.500057423677521 | 0.749971288161239 |
| 14 | 0.780239027916043 | 0.439521944167915 | 0.219760972083957 |
| 15 | 0.737191744272082 | 0.525616511455836 | 0.262808255727918 |
| 16 | 0.885496979969198 | 0.229006040061604 | 0.114503020030802 |
| 17 | 0.845884676851504 | 0.308230646296993 | 0.154115323148496 |
| 18 | 0.806542468511267 | 0.386915062977465 | 0.193457531488733 |
| 19 | 0.736823553416327 | 0.526352893167347 | 0.263176446583673 |
| 20 | 0.750964898695285 | 0.49807020260943 | 0.249035101304715 |
| 21 | 0.713314494064707 | 0.573371011870586 | 0.286685505935293 |
| 22 | 0.637050301376214 | 0.725899397247572 | 0.362949698623786 |
| 23 | 0.748871637637303 | 0.502256724725393 | 0.251128362362697 |
| 24 | 0.781392460060118 | 0.437215079879765 | 0.218607539939882 |
| 25 | 0.722843418961977 | 0.554313162076047 | 0.277156581038023 |
| 26 | 0.676774346499516 | 0.646451307000967 | 0.323225653500484 |
| 27 | 0.663865455269376 | 0.672269089461248 | 0.336134544730624 |
| 28 | 0.59300824955177 | 0.81398350089646 | 0.40699175044823 |
| 29 | 0.538080569198442 | 0.923838861603116 | 0.461919430801558 |
| 30 | 0.464015188923457 | 0.928030377846914 | 0.535984811076543 |
| 31 | 0.402641175163599 | 0.805282350327199 | 0.597358824836401 |
| 32 | 0.324324743272499 | 0.648649486544997 | 0.675675256727502 |
| 33 | 0.26010223302623 | 0.52020446605246 | 0.73989776697377 |
| 34 | 0.25017303057408 | 0.50034606114816 | 0.74982696942592 |
| 35 | 0.263459601523975 | 0.526919203047951 | 0.736540398476025 |
| 36 | 0.200062363605205 | 0.400124727210409 | 0.799937636394795 |
| 37 | 0.332267391374227 | 0.664534782748454 | 0.667732608625773 |
| 38 | 0.2910142157713 | 0.5820284315426 | 0.7089857842287 |
| 39 | 0.49859651140472 | 0.99719302280944 | 0.50140348859528 |
| 40 | 0.432850843625555 | 0.865701687251109 | 0.567149156374445 |
| 41 | 0.34999935203667 | 0.699998704073339 | 0.65000064796333 |
| 42 | 0.331903280400857 | 0.663806560801714 | 0.668096719599143 |
| 43 | 0.484792764184787 | 0.969585528369575 | 0.515207235815213 |
| 44 | 0.386639176899089 | 0.773278353798178 | 0.613360823100911 |
| 45 | 0.578858505177855 | 0.84228298964429 | 0.421141494822145 |
| 46 | 0.461224167451828 | 0.922448334903657 | 0.538775832548172 |
| 47 | 0.344375681157159 | 0.688751362314319 | 0.655624318842841 |
| 48 | 0.922889908614788 | 0.154220182770425 | 0.0771100913852123 |
| 49 | 0.85446786117229 | 0.29106427765542 | 0.14553213882771 |
| 50 | 0.717305599422041 | 0.565388801155918 | 0.282694400577959 |
| Meta Analysis of Goldfeld-Quandt test for Heteroskedasticity | |||
| Description | # significant tests | % significant tests | OK/NOK |
| 1% type I error level | 0 | 0 | OK |
| 5% type I error level | 0 | 0 | OK |
| 10% type I error level | 0 | 0 | OK |