| Multiple Linear Regression - Estimated Regression Equation |
| Werkloosheid_BRUSSELS_HOOFDSTEDELIJK_GEWEST[t] = + 62563.6644381663 + 1.57460189433131Werkloosheid_ANTWERPEN[t] + 0.390143895024618`Werkloosheid_VLAAMS-BRABANT`[t] + 0.190514181494486`Werkloosheid_WAALS-BRABANT`[t] -0.532879882911811`Werkloosheid_WEST-VLAANDEREN`[t] -1.06054429055137`Werkloosheid_OOST-VLAANDEREN`[t] -0.178659030213334Werkloosheid_HENEGOUWEN[t] -0.856280147459766Werkloosheid_LUIK[t] -0.326671455987136Werkloosheid_LIMBURG[t] + 0.455374238448602Werkloosheid_LUXEMBURG[t] + 2.48013083591232Werkloosheid_NAMEN[t] + e[t] |
| Multiple Linear Regression - Ordinary Least Squares | |||||
| Variable | Parameter | S.D. | T-STAT H0: parameter = 0 | 2-tail p-value | 1-tail p-value |
| (Intercept) | 62563.6644381663 | 8977.501044 | 6.9689 | 0 | 0 |
| Werkloosheid_ANTWERPEN | 1.57460189433131 | 0.196473 | 8.0143 | 0 | 0 |
| `Werkloosheid_VLAAMS-BRABANT` | 0.390143895024618 | 0.523471 | 0.7453 | 0.45855 | 0.229275 |
| `Werkloosheid_WAALS-BRABANT` | 0.190514181494486 | 0.793214 | 0.2402 | 0.810883 | 0.405441 |
| `Werkloosheid_WEST-VLAANDEREN` | -0.532879882911811 | 0.296361 | -1.7981 | 0.076416 | 0.038208 |
| `Werkloosheid_OOST-VLAANDEREN` | -1.06054429055137 | 0.383501 | -2.7654 | 0.007239 | 0.00362 |
| Werkloosheid_HENEGOUWEN | -0.178659030213334 | 0.189271 | -0.9439 | 0.348406 | 0.174203 |
| Werkloosheid_LUIK | -0.856280147459766 | 0.191969 | -4.4605 | 3e-05 | 1.5e-05 |
| Werkloosheid_LIMBURG | -0.326671455987136 | 0.497867 | -0.6561 | 0.513853 | 0.256927 |
| Werkloosheid_LUXEMBURG | 0.455374238448602 | 0.889522 | 0.5119 | 0.610288 | 0.305144 |
| Werkloosheid_NAMEN | 2.48013083591232 | 0.606757 | 4.0875 | 0.000113 | 5.7e-05 |
| Multiple Linear Regression - Regression Statistics | |
| Multiple R | 0.982628358041529 |
| R-squared | 0.965558490027392 |
| Adjusted R-squared | 0.960707573129841 |
| F-TEST (value) | 199.046594781898 |
| F-TEST (DF numerator) | 10 |
| F-TEST (DF denominator) | 71 |
| p-value | 0 |
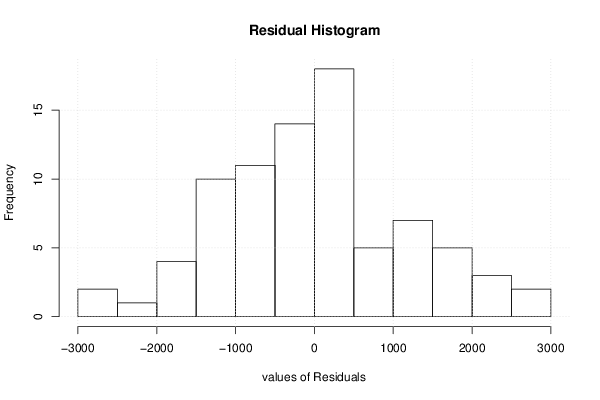
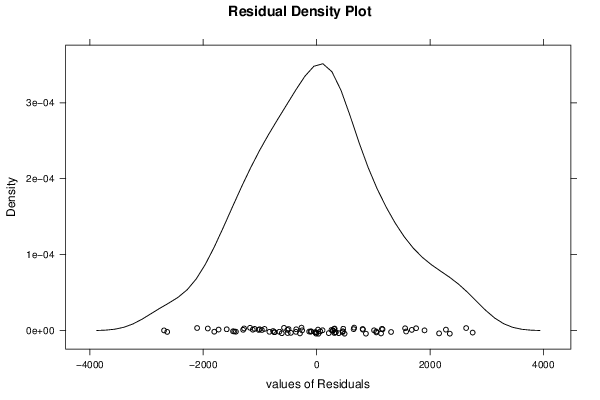
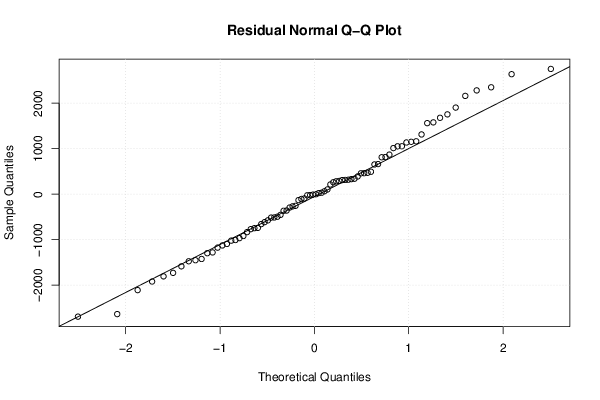
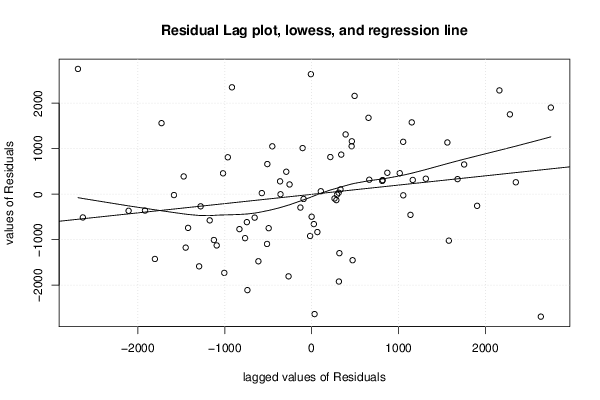
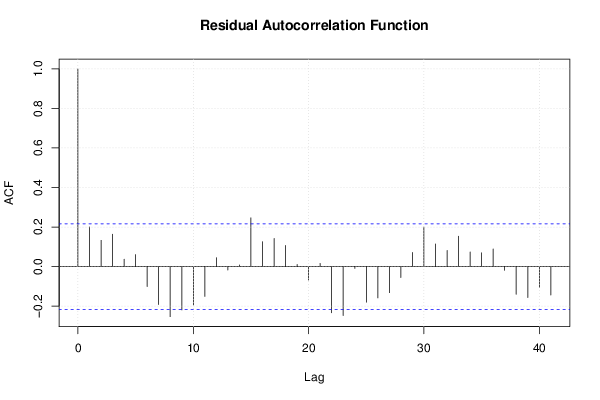
| Multiple Linear Regression - Residual Statistics | |
| Residual Standard Deviation | 1252.93930041798 |
| Sum Squared Residuals | 111459839.227765 |
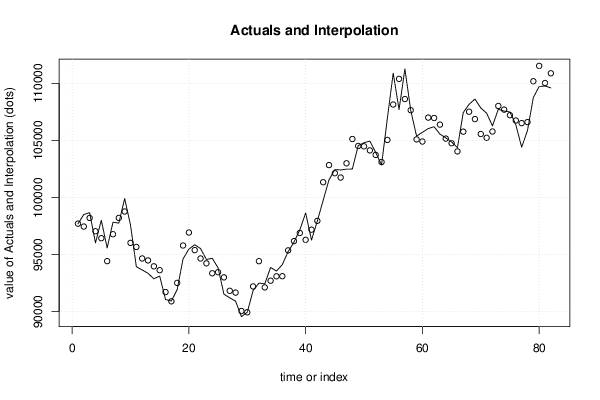
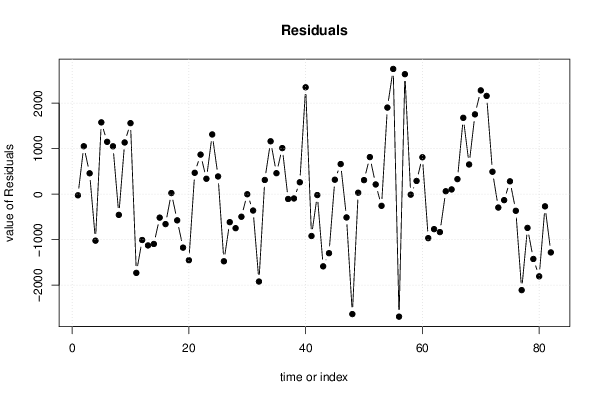
| Multiple Linear Regression - Actuals, Interpolation, and Residuals | |||
| Time or Index | Actuals | Interpolation Forecast | Residuals Prediction Error |
| 1 | 97687 | 97711.1931456625 | -24.1931456624716 |
| 2 | 98512 | 97458.4147577874 | 1053.58524221262 |
| 3 | 98673 | 98213.710029071 | 459.289970929 |
| 4 | 96028 | 97048.5929473528 | -1020.59294735274 |
| 5 | 98014 | 96435.7025438997 | 1578.29745610033 |
| 6 | 95580 | 94428.6862545625 | 1151.31374543752 |
| 7 | 97838 | 96785.3520565737 | 1052.64794342626 |
| 8 | 97760 | 98213.8617539905 | -453.861753990453 |
| 9 | 99913 | 98776.5117570998 | 1136.48824290025 |
| 10 | 97588 | 96027.0506244151 | 1560.94937558487 |
| 11 | 93942 | 95670.4478970048 | -1728.44789700481 |
| 12 | 93656 | 94662.2712811815 | -1006.27128118146 |
| 13 | 93365 | 94490.4037950793 | -1125.40379507927 |
| 14 | 92881 | 93974.3905991304 | -1093.39059913042 |
| 15 | 93120 | 93634.2979897758 | -514.297989775837 |
| 16 | 91063 | 91719.569224229 | -656.569224229004 |
| 17 | 90930 | 90905.2026762778 | 24.797323722187 |
| 18 | 91946 | 92520.2936145572 | -574.293614557225 |
| 19 | 94624 | 95797.7796807931 | -1173.77968079309 |
| 20 | 95484 | 96934.2822180759 | -1450.28221807591 |
| 21 | 95862 | 95391.473572796 | 470.526427204036 |
| 22 | 95530 | 94660.1323584436 | 869.86764155639 |
| 23 | 94574 | 94234.2983398955 | 339.701660104546 |
| 24 | 94677 | 93363.8567712723 | 1313.14322872766 |
| 25 | 93845 | 93454.6896117537 | 390.310388246351 |
| 26 | 91533 | 93006.3987209122 | -1473.39872091217 |
| 27 | 91214 | 91827.791116087 | -613.791116086981 |
| 28 | 90922 | 91668.3350147213 | -746.335014721258 |
| 29 | 89563 | 90058.1295444415 | -495.129544441531 |
| 30 | 89945 | 89945.7219207439 | -0.721920743880667 |
| 31 | 91850 | 92209.0518741837 | -359.051874183713 |
| 32 | 92505 | 94423.7130030309 | -1918.71300303091 |
| 33 | 92437 | 92124.1296546039 | 312.87034539612 |
| 34 | 93876 | 92713.028155754 | 1162.97184424601 |
| 35 | 93561 | 93099.2934464043 | 461.706553595722 |
| 36 | 94119 | 93105.8853536965 | 1013.11464630346 |
| 37 | 95264 | 95368.7590030497 | -104.759003049663 |
| 38 | 96089 | 96182.6523457532 | -93.6523457532225 |
| 39 | 97160 | 96897.4173889187 | 262.582611081273 |
| 40 | 98644 | 96295.0103031642 | 2348.98969683576 |
| 41 | 96266 | 97183.9505858925 | -917.950585892512 |
| 42 | 97938 | 97956.6030082684 | -18.6030082684264 |
| 43 | 99757 | 101342.063480864 | -1585.06348086382 |
| 44 | 101550 | 102845.795431364 | -1295.79543136444 |
| 45 | 102449 | 102130.820880366 | 318.179119634334 |
| 46 | 102416 | 101753.83948073 | 662.160519270286 |
| 47 | 102491 | 103001.735372156 | -510.735372156271 |
| 48 | 102495 | 105128.957465588 | -2633.95746558787 |
| 49 | 104552 | 104519.36016839 | 32.6398316101341 |
| 50 | 104798 | 104487.918946935 | 310.081053065016 |
| 51 | 104947 | 104130.814137261 | 816.18586273932 |
| 52 | 103950 | 103735.890399249 | 214.109600750809 |
| 53 | 102858 | 103113.07222441 | -255.072224409963 |
| 54 | 106952 | 105048.624103995 | 1903.37589600496 |
| 55 | 110901 | 108148.904274649 | 2752.09572535112 |
| 56 | 107706 | 110396.230109748 | -2690.23010974763 |
| 57 | 111267 | 108630.129615795 | 2636.87038420497 |
| 58 | 107643 | 107652.494220787 | -9.49422078734734 |
| 59 | 105387 | 105095.509152783 | 291.490847216667 |
| 60 | 105718 | 104906.233929847 | 811.766070152672 |
| 61 | 106039 | 107004.665621749 | -965.665621749387 |
| 62 | 106203 | 106970.223411685 | -767.223411684553 |
| 63 | 105558 | 106390.143127813 | -832.143127812863 |
| 64 | 105230 | 105164.96220721 | 65.0377927902213 |
| 65 | 104864 | 104759.282428857 | 104.717571143062 |
| 66 | 104374 | 104042.951736921 | 331.048263078653 |
| 67 | 107450 | 105771.545314068 | 1678.4546859321 |
| 68 | 108173 | 107519.565845039 | 653.434154960768 |
| 69 | 108629 | 106874.646764759 | 1754.35323524147 |
| 70 | 107847 | 105566.142265679 | 2280.85773432086 |
| 71 | 107394 | 105234.037350398 | 2159.96264960201 |
| 72 | 106278 | 105784.466182765 | 493.533817234868 |
| 73 | 107733 | 108026.078391107 | -293.07839110692 |
| 74 | 107573 | 107703.272520059 | -130.272520059061 |
| 75 | 107500 | 107216.853514535 | 283.146485464665 |
| 76 | 106382 | 106746.189384165 | -364.189384164825 |
| 77 | 104412 | 106519.527099757 | -2107.52709975687 |
| 78 | 105871 | 106611.158928104 | -740.158928104065 |
| 79 | 108767 | 110189.890747939 | -1422.89074793866 |
| 80 | 109728 | 111532.449540681 | -1804.44954068127 |
| 81 | 109769 | 110035.556031718 | -266.556031718201 |
| 82 | 109609 | 110887.662249768 | -1278.66224976837 |
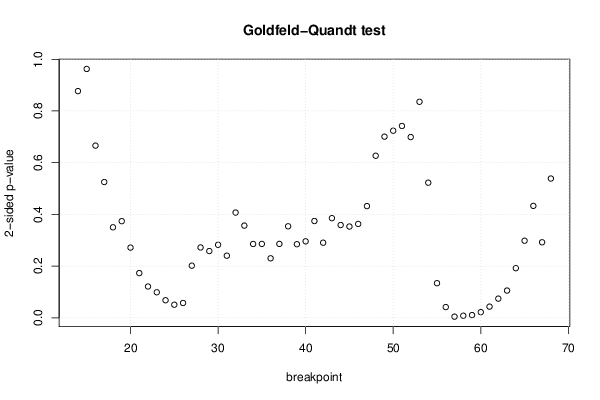
| Goldfeld-Quandt test for Heteroskedasticity | |||
| p-values | Alternative Hypothesis | ||
| breakpoint index | greater | 2-sided | less |
| 14 | 0.561538881245884 | 0.876922237508232 | 0.438461118754116 |
| 15 | 0.481297154162941 | 0.962594308325882 | 0.518702845837059 |
| 16 | 0.333028030601297 | 0.666056061202593 | 0.666971969398703 |
| 17 | 0.262631116445717 | 0.525262232891434 | 0.737368883554283 |
| 18 | 0.17510444091658 | 0.350208881833161 | 0.82489555908342 |
| 19 | 0.186894912025809 | 0.373789824051617 | 0.813105087974191 |
| 20 | 0.135781966675818 | 0.271563933351637 | 0.864218033324182 |
| 21 | 0.0864446448583297 | 0.172889289716659 | 0.91355535514167 |
| 22 | 0.0605557220159174 | 0.121111444031835 | 0.939444277984083 |
| 23 | 0.0494159066992616 | 0.0988318133985231 | 0.950584093300738 |
| 24 | 0.0339589194561201 | 0.0679178389122402 | 0.96604108054388 |
| 25 | 0.0253316306233623 | 0.0506632612467246 | 0.974668369376638 |
| 26 | 0.0287051539524896 | 0.0574103079049791 | 0.97129484604751 |
| 27 | 0.100829766997354 | 0.201659533994709 | 0.899170233002646 |
| 28 | 0.136042855754309 | 0.272085711508617 | 0.863957144245691 |
| 29 | 0.129118261724496 | 0.258236523448993 | 0.870881738275504 |
| 30 | 0.141209328232164 | 0.282418656464328 | 0.858790671767836 |
| 31 | 0.120162525193882 | 0.240325050387764 | 0.879837474806118 |
| 32 | 0.203555587031021 | 0.407111174062041 | 0.796444412968979 |
| 33 | 0.178352816596633 | 0.356705633193266 | 0.821647183403367 |
| 34 | 0.142793431468249 | 0.285586862936499 | 0.85720656853175 |
| 35 | 0.142953601981553 | 0.285907203963106 | 0.857046398018447 |
| 36 | 0.115098901399535 | 0.23019780279907 | 0.884901098600465 |
| 37 | 0.14299081170668 | 0.28598162341336 | 0.85700918829332 |
| 38 | 0.177016281145682 | 0.354032562291363 | 0.822983718854318 |
| 39 | 0.142361090404583 | 0.284722180809167 | 0.857638909595417 |
| 40 | 0.147960156912685 | 0.295920313825371 | 0.852039843087315 |
| 41 | 0.187206518804859 | 0.374413037609717 | 0.812793481195141 |
| 42 | 0.145289321367681 | 0.290578642735361 | 0.854710678632319 |
| 43 | 0.192735122616023 | 0.385470245232047 | 0.807264877383977 |
| 44 | 0.17945838260845 | 0.3589167652169 | 0.82054161739155 |
| 45 | 0.17655882987746 | 0.353117659754921 | 0.82344117012254 |
| 46 | 0.181549125255785 | 0.363098250511571 | 0.818450874744215 |
| 47 | 0.216099743408598 | 0.432199486817197 | 0.783900256591402 |
| 48 | 0.313432868208923 | 0.626865736417846 | 0.686567131791077 |
| 49 | 0.350328540233773 | 0.700657080467546 | 0.649671459766227 |
| 50 | 0.361844584233919 | 0.723689168467837 | 0.638155415766081 |
| 51 | 0.370994385016496 | 0.741988770032992 | 0.629005614983504 |
| 52 | 0.349574183487821 | 0.699148366975642 | 0.650425816512179 |
| 53 | 0.582192170964881 | 0.835615658070238 | 0.417807829035119 |
| 54 | 0.738687772435224 | 0.522624455129552 | 0.261312227564776 |
| 55 | 0.933018565822732 | 0.133962868354536 | 0.0669814341772682 |
| 56 | 0.979205810378209 | 0.0415883792435828 | 0.0207941896217914 |
| 57 | 0.99773878810146 | 0.00452242379707909 | 0.00226121189853954 |
| 58 | 0.995937383535604 | 0.00812523292879263 | 0.00406261646439631 |
| 59 | 0.994683275974825 | 0.0106334480503501 | 0.00531672402517505 |
| 60 | 0.988993158693363 | 0.0220136826132746 | 0.0110068413066373 |
| 61 | 0.978395446420974 | 0.0432091071580517 | 0.0216045535790259 |
| 62 | 0.962893383243043 | 0.0742132335139132 | 0.0371066167569566 |
| 63 | 0.947265929241239 | 0.105468141517523 | 0.0527340707587614 |
| 64 | 0.904006597256365 | 0.191986805487271 | 0.0959934027436353 |
| 65 | 0.850914331394033 | 0.298171337211934 | 0.149085668605967 |
| 66 | 0.783493058753848 | 0.433013882492303 | 0.216506941246152 |
| 67 | 0.853911893702082 | 0.292176212595837 | 0.146088106297918 |
| 68 | 0.730607002654527 | 0.538785994690945 | 0.269392997345473 |
| Meta Analysis of Goldfeld-Quandt test for Heteroskedasticity | |||
| Description | # significant tests | % significant tests | OK/NOK |
| 1% type I error level | 2 | 0.0363636363636364 | NOK |
| 5% type I error level | 6 | 0.109090909090909 | NOK |
| 10% type I error level | 11 | 0.2 | NOK |