| Multiple Linear Regression - Estimated Regression Equation |
| 2005/12[t] = + 0.00472891862713576 + 0.129933274148402`2005/11`[t] + 1.38134444423706`2005/10`[t] -0.689395298957021`2005/09`[t] + 1.06575281674565`2005/08`[t] -1.11502202842671`2005/07`[t] + 0.980661518292317`2005/06`[t] -0.107463644420801`2005/05`[t] -0.961060792363887`2005/04`[t] -1.19812820806339`2005/03`[t] + 2.09852327243365`2005/02`[t] -0.586487789996359`2005/01`[t] -0.000641674979176878t + e[t] |
| Multiple Linear Regression - Ordinary Least Squares | |||||
| Variable | Parameter | S.D. | T-STAT H0: parameter = 0 | 2-tail p-value | 1-tail p-value |
| (Intercept) | 0.00472891862713576 | 0.012293 | 0.3847 | 0.707801 | 0.353901 |
| `2005/11` | 0.129933274148402 | 0.430036 | 0.3021 | 0.768178 | 0.384089 |
| `2005/10` | 1.38134444423706 | 0.382726 | 3.6092 | 0.004103 | 0.002052 |
| `2005/09` | -0.689395298957021 | 0.363395 | -1.8971 | 0.084364 | 0.042182 |
| `2005/08` | 1.06575281674565 | 0.580856 | 1.8348 | 0.093699 | 0.04685 |
| `2005/07` | -1.11502202842671 | 0.634499 | -1.7573 | 0.106621 | 0.05331 |
| `2005/06` | 0.980661518292317 | 0.626425 | 1.5655 | 0.145764 | 0.072882 |
| `2005/05` | -0.107463644420801 | 0.375197 | -0.2864 | 0.77988 | 0.38994 |
| `2005/04` | -0.961060792363887 | 0.470669 | -2.0419 | 0.065888 | 0.032944 |
| `2005/03` | -1.19812820806339 | 0.737364 | -1.6249 | 0.13247 | 0.066235 |
| `2005/02` | 2.09852327243365 | 0.819942 | 2.5594 | 0.026549 | 0.013275 |
| `2005/01` | -0.586487789996359 | 0.194042 | -3.0225 | 0.011604 | 0.005802 |
| t | -0.000641674979176878 | 0.001173 | -0.547 | 0.595313 | 0.297656 |
| Multiple Linear Regression - Regression Statistics | |
| Multiple R | 0.99999205700978 |
| R-squared | 0.999984114082651 |
| Adjusted R-squared | 0.999966783990997 |
| F-TEST (value) | 57702.1826573012 |
| F-TEST (DF numerator) | 12 |
| F-TEST (DF denominator) | 11 |
| p-value | 0 |
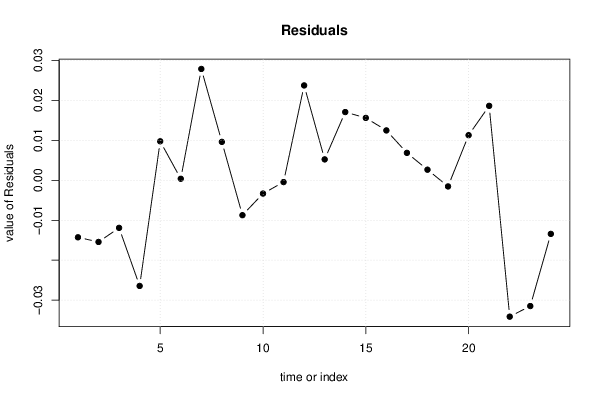
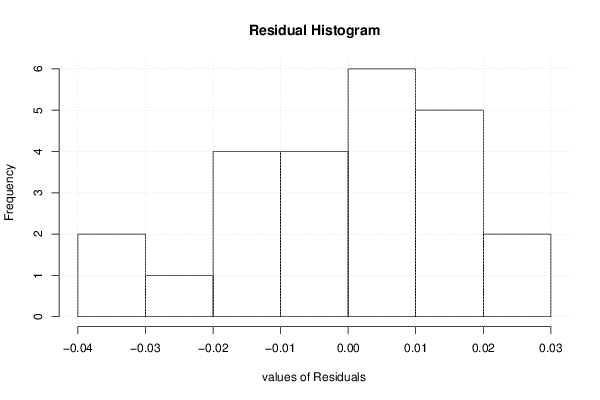
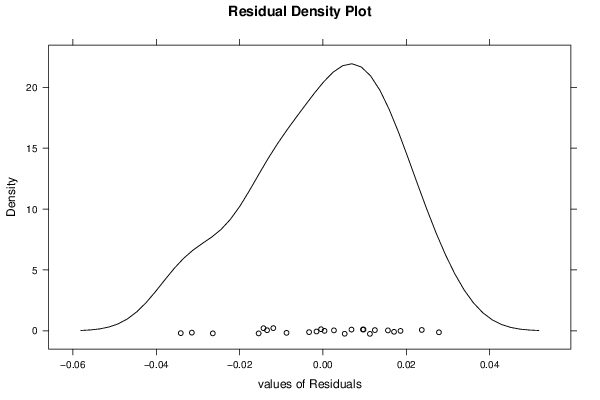
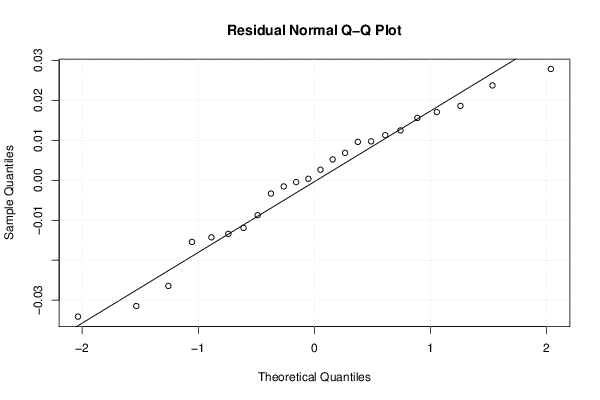
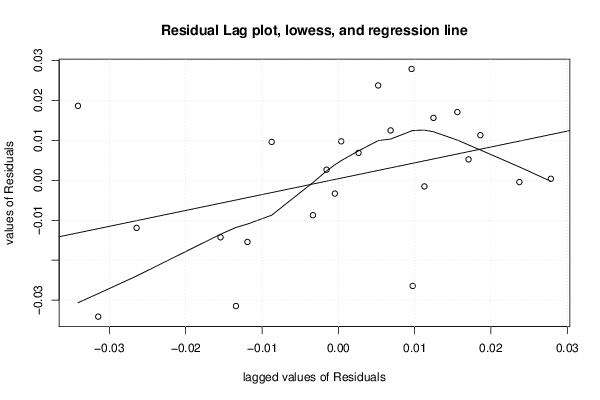
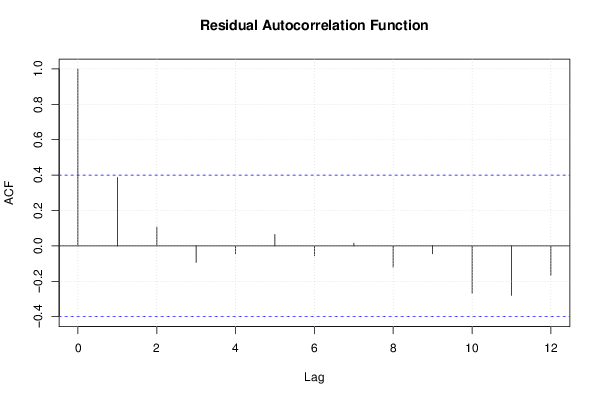
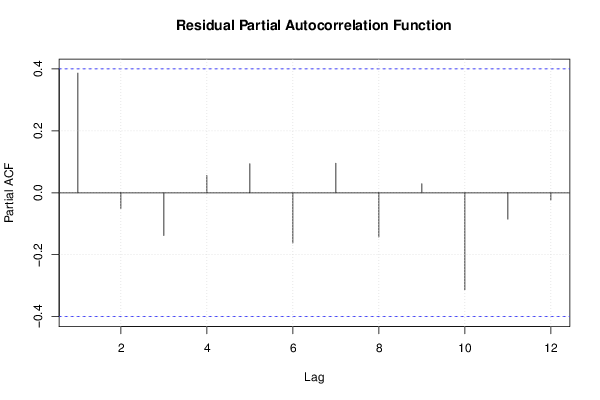
| Multiple Linear Regression - Residual Statistics | |
| Residual Standard Deviation | 0.0242650456291831 |
| Sum Squared Residuals | 0.0064767168332497 |
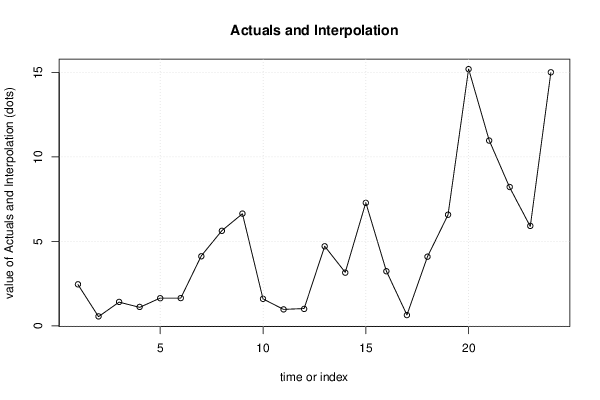
| Multiple Linear Regression - Actuals, Interpolation, and Residuals | |||
| Time or Index | Actuals | Interpolation Forecast | Residuals Prediction Error |
| 1 | 2.45 | 2.46426526863613 | -0.0142652686361256 |
| 2 | 0.55 | 0.56542919313168 | -0.01542919313168 |
| 3 | 1.41 | 1.42190685348082 | -0.0119068534808228 |
| 4 | 1.1 | 1.12643127277518 | -0.0264312727751839 |
| 5 | 1.65 | 1.64025258062521 | 0.00974741937479462 |
| 6 | 1.65 | 1.64962190245401 | 0.000378097545989533 |
| 7 | 4.15 | 4.12214950736056 | 0.0278504926394451 |
| 8 | 5.64 | 5.63039497176511 | 0.00960502823488586 |
| 9 | 6.64 | 6.64873417208688 | -0.00873417208687876 |
| 10 | 1.6 | 1.60332316234763 | -0.00332316234763146 |
| 11 | 0.98 | 0.98045203267049 | -0.000452032670489602 |
| 12 | 1.03 | 1.00627362215215 | 0.0237263778478514 |
| 13 | 4.72 | 4.71477688236994 | 0.00522311763005661 |
| 14 | 3.17 | 3.15293269214808 | 0.0170673078519161 |
| 15 | 7.3 | 7.28439815650713 | 0.0156018434928701 |
| 16 | 3.25 | 3.23752863711519 | 0.0124713628848054 |
| 17 | 0.65 | 0.64314386759921 | 0.00685613240078949 |
| 18 | 4.1 | 4.09735327983454 | 0.00264672016545869 |
| 19 | 6.58 | 6.581539817959 | -0.00153981795900251 |
| 20 | 15.21 | 15.1987196059724 | 0.0112803940275865 |
| 21 | 10.99 | 10.9713845058381 | 0.0186154941619101 |
| 22 | 8.19 | 8.22411632046864 | -0.0341163204686408 |
| 23 | 5.89 | 5.92146044236279 | -0.0314604423627941 |
| 24 | 15 | 15.0134112523391 | -0.0134112523391101 |