| Multiple Linear Regression - Estimated Regression Equation |
| Y1[t] = + 100.393611638968 + 0.332336476662426X1[t] + 3.99817389808975X2[t] + 1.85791247072403X3[t] + 7.83886063212366X4[t] + 2.55876932475728X5[t] -3.23116194241755X6[t] + e[t] |
| Multiple Linear Regression - Ordinary Least Squares | |||||
| Variable | Parameter | S.D. | T-STAT H0: parameter = 0 | 2-tail p-value | 1-tail p-value |
| (Intercept) | 100.393611638968 | 370.693175 | 0.2708 | 0.78782 | 0.39391 |
| X1 | 0.332336476662426 | 0.059617 | 5.5745 | 2e-06 | 1e-06 |
| X2 | 3.99817389808975 | 2.682483 | 1.4905 | 0.143399 | 0.071699 |
| X3 | 1.85791247072403 | 5.240873 | 0.3545 | 0.724694 | 0.362347 |
| X4 | 7.83886063212366 | 7.759872 | 1.0102 | 0.31806 | 0.15903 |
| X5 | 2.55876932475728 | 3.426952 | 0.7467 | 0.459332 | 0.229666 |
| X6 | -3.23116194241755 | 10.715371 | -0.3015 | 0.764453 | 0.382226 |
| Multiple Linear Regression - Regression Statistics | |
| Multiple R | 0.783045775972243 |
| R-squared | 0.613160687267972 |
| Adjusted R-squared | 0.559183108747223 |
| F-TEST (value) | 11.3595441676266 |
| F-TEST (DF numerator) | 6 |
| F-TEST (DF denominator) | 43 |
| p-value | 1.42426969884646e-07 |
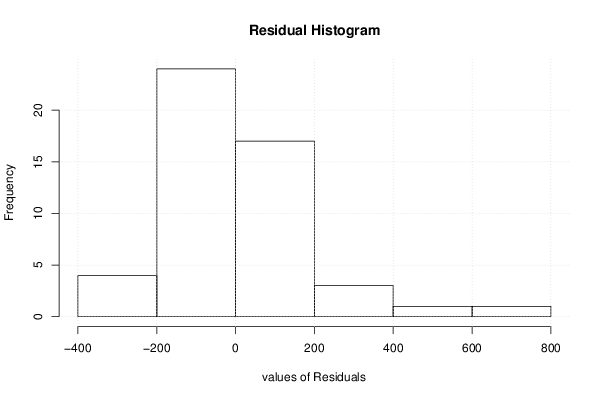
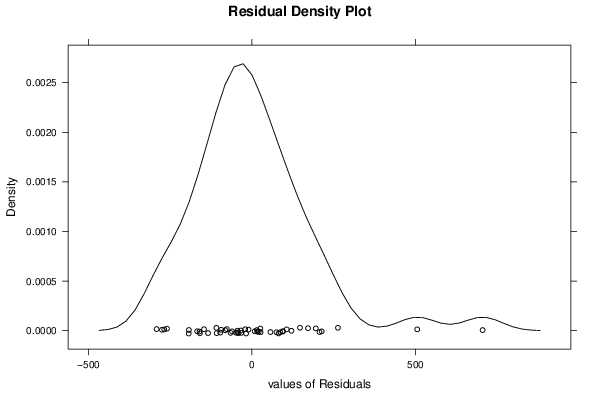
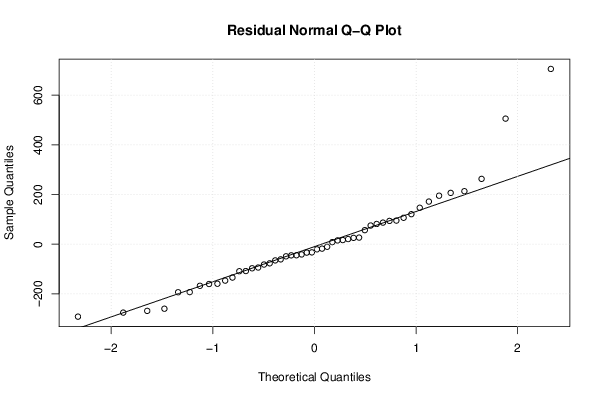
| Multiple Linear Regression - Residual Statistics | |
| Residual Standard Deviation | 195.157830190179 |
| Sum Squared Residuals | 1637722.88343517 |
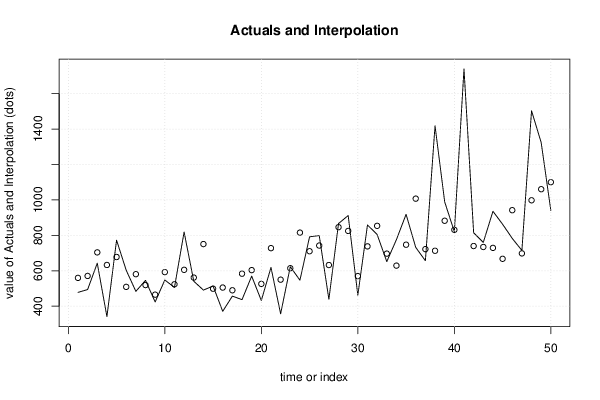
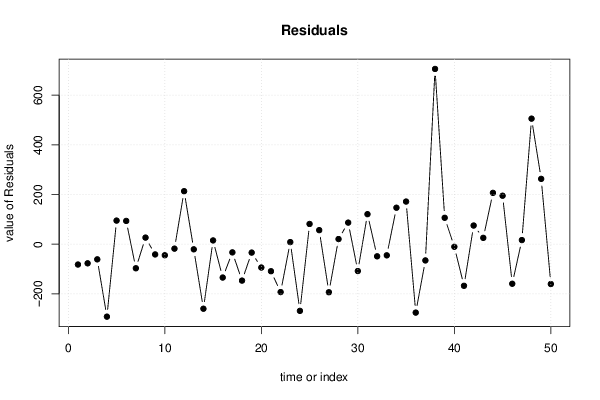
| Multiple Linear Regression - Actuals, Interpolation, and Residuals | |||
| Time or Index | Actuals | Interpolation Forecast | Residuals Prediction Error |
| 1 | 478 | 559.882079274507 | -81.8820792745071 |
| 2 | 494 | 570.986176753474 | -76.9861767534744 |
| 3 | 643 | 704.005363678289 | -61.0053636782892 |
| 4 | 341 | 632.823520381786 | -291.823520381786 |
| 5 | 773 | 677.921158060777 | 95.0788419392227 |
| 6 | 603 | 509.217565345635 | 93.7824346543646 |
| 7 | 484 | 580.919451284355 | -96.9194512843549 |
| 8 | 546 | 519.430192024605 | 26.5698079753946 |
| 9 | 424 | 465.219932798116 | -41.2199327981162 |
| 10 | 548 | 592.558206662016 | -44.5582066620163 |
| 11 | 506 | 523.893430174056 | -17.8934301740559 |
| 12 | 819 | 605.520749206515 | 213.479250793485 |
| 13 | 541 | 561.610429575029 | -20.610429575029 |
| 14 | 491 | 750.878862426951 | -259.878862426951 |
| 15 | 514 | 498.821369587328 | 15.1786304126716 |
| 16 | 371 | 505.313879684233 | -134.313879684233 |
| 17 | 457 | 489.951621037286 | -32.9516210372863 |
| 18 | 437 | 583.595210986059 | -146.595210986059 |
| 19 | 570 | 603.776048293387 | -33.7760482933869 |
| 20 | 432 | 526.017630951951 | -94.0176309519513 |
| 21 | 619 | 727.874003901545 | -108.874003901545 |
| 22 | 357 | 549.932038770365 | -192.932038770365 |
| 23 | 623 | 614.592314678273 | 8.40768532172732 |
| 24 | 547 | 815.576777312715 | -268.576777312715 |
| 25 | 792 | 710.460998504885 | 81.5390014951147 |
| 26 | 799 | 742.454877441474 | 56.5451225585262 |
| 27 | 439 | 632.543583986624 | -193.543583986624 |
| 28 | 867 | 846.265663547525 | 20.7343364524746 |
| 29 | 912 | 825.024731951949 | 86.9752680480505 |
| 30 | 462 | 570.104677478719 | -108.104677478719 |
| 31 | 859 | 738.086124885779 | 120.913875114221 |
| 32 | 805 | 853.830735861158 | -48.830735861158 |
| 33 | 652 | 696.861648752452 | -44.8616487524522 |
| 34 | 776 | 629.086786834156 | 146.913213165844 |
| 35 | 919 | 747.238641249239 | 171.761358750761 |
| 36 | 732 | 1007.49617940853 | -275.496179408532 |
| 37 | 657 | 722.310437860598 | -65.3104378605984 |
| 38 | 1419 | 713.109341221742 | 705.890658778258 |
| 39 | 989 | 882.601833249775 | 106.398166750225 |
| 40 | 821 | 831.415365596305 | -10.4153655963048 |
| 41 | 1740 | 1907.60530244396 | -167.605302443964 |
| 42 | 815 | 739.800120274406 | 75.1998797255943 |
| 43 | 760 | 734.416170474564 | 25.5838295254363 |
| 44 | 936 | 729.284709842033 | 206.715290157967 |
| 45 | 863 | 667.718509057974 | 195.281490942026 |
| 46 | 783 | 942.240759548306 | -159.240759548306 |
| 47 | 715 | 698.317371867057 | 16.6826281329432 |
| 48 | 1504 | 998.258650167046 | 505.741349832954 |
| 49 | 1324 | 1060.79933102286 | 263.200668977144 |
| 50 | 940 | 1100.34943462162 | -160.349434621625 |
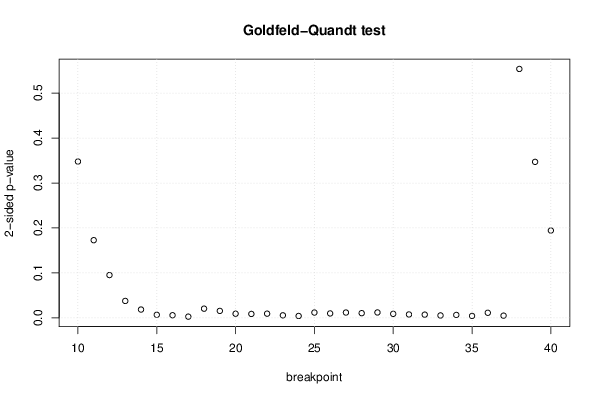
| Goldfeld-Quandt test for Heteroskedasticity | |||
| p-values | Alternative Hypothesis | ||
| breakpoint index | greater | 2-sided | less |
| 10 | 0.173871661398889 | 0.347743322797778 | 0.826128338601111 |
| 11 | 0.0864011740092484 | 0.172802348018497 | 0.913598825990752 |
| 12 | 0.0476046255392966 | 0.0952092510785932 | 0.952395374460703 |
| 13 | 0.0188320931213855 | 0.037664186242771 | 0.981167906878615 |
| 14 | 0.00927267470836959 | 0.0185453494167392 | 0.99072732529163 |
| 15 | 0.00341191505290532 | 0.00682383010581064 | 0.996588084947095 |
| 16 | 0.00294214366907481 | 0.00588428733814962 | 0.997057856330925 |
| 17 | 0.00136866581955521 | 0.00273733163911043 | 0.998631334180445 |
| 18 | 0.0102408162283903 | 0.0204816324567805 | 0.98975918377161 |
| 19 | 0.00775207207359757 | 0.0155041441471951 | 0.992247927926402 |
| 20 | 0.00461596152141962 | 0.00923192304283924 | 0.99538403847858 |
| 21 | 0.00440225877865459 | 0.00880451755730919 | 0.995597741221345 |
| 22 | 0.00470053495172911 | 0.00940106990345821 | 0.995299465048271 |
| 23 | 0.00282960224033255 | 0.00565920448066511 | 0.997170397759667 |
| 24 | 0.00213011391420895 | 0.0042602278284179 | 0.997869886085791 |
| 25 | 0.00593247780087925 | 0.0118649556017585 | 0.994067522199121 |
| 26 | 0.0049412282081832 | 0.0098824564163664 | 0.995058771791817 |
| 27 | 0.00594441898084976 | 0.0118888379616995 | 0.99405558101915 |
| 28 | 0.0052435694391657 | 0.0104871388783314 | 0.994756430560834 |
| 29 | 0.00603440770579841 | 0.0120688154115968 | 0.993965592294202 |
| 30 | 0.00447643267443419 | 0.00895286534886838 | 0.995523567325566 |
| 31 | 0.00379898128916591 | 0.00759796257833183 | 0.996201018710834 |
| 32 | 0.00358390113690892 | 0.00716780227381783 | 0.996416098863091 |
| 33 | 0.0026912514843837 | 0.00538250296876739 | 0.997308748515616 |
| 34 | 0.00325367618388838 | 0.00650735236777676 | 0.996746323816112 |
| 35 | 0.00214346522983136 | 0.00428693045966272 | 0.997856534770169 |
| 36 | 0.00567924203840293 | 0.0113584840768059 | 0.994320757961597 |
| 37 | 0.00247264419071449 | 0.00494528838142898 | 0.997527355809286 |
| 38 | 0.276828655512083 | 0.553657311024166 | 0.723171344487917 |
| 39 | 0.173496972838568 | 0.346993945677136 | 0.826503027161432 |
| 40 | 0.0971595168954665 | 0.194319033790933 | 0.902840483104534 |
| Meta Analysis of Goldfeld-Quandt test for Heteroskedasticity | |||
| Description | # significant tests | % significant tests | OK/NOK |
| 1% type I error level | 16 | 0.516129032258065 | NOK |
| 5% type I error level | 25 | 0.806451612903226 | NOK |
| 10% type I error level | 26 | 0.838709677419355 | NOK |