| Multiple Linear Regression - Estimated Regression Equation |
| Exchange_rate[t] = + 1.4394024 -0.0305847777777778M1[t] -0.0344024888888889M2[t] -0.00907020000000007M3[t] + 0.0072120888888888M4[t] -0.00858895555555562M5[t] -0.0121233333333334M6[t] + 0.00259228888888877M7[t] -0.00234208888888892M8[t] -0.000393133333333388M9[t] + 0.0154754222222222M10[t] + 0.00866771111111108M11[t] -0.00163228888888889t + e[t] |
| Multiple Linear Regression - Ordinary Least Squares | |||||
| Variable | Parameter | S.D. | T-STAT H0: parameter = 0 | 2-tail p-value | 1-tail p-value |
| (Intercept) | 1.4394024 | 0.043226 | 33.2994 | 0 | 0 |
| M1 | -0.0305847777777778 | 0.052626 | -0.5812 | 0.563459 | 0.281729 |
| M2 | -0.0344024888888889 | 0.052602 | -0.654 | 0.515783 | 0.257891 |
| M3 | -0.00907020000000007 | 0.052584 | -0.1725 | 0.863674 | 0.431837 |
| M4 | 0.0072120888888888 | 0.052571 | 0.1372 | 0.891374 | 0.445687 |
| M5 | -0.00858895555555562 | 0.052563 | -0.1634 | 0.870789 | 0.435394 |
| M6 | -0.0121233333333334 | 0.05256 | -0.2307 | 0.818422 | 0.409211 |
| M7 | 0.00259228888888877 | 0.052563 | 0.0493 | 0.960841 | 0.480421 |
| M8 | -0.00234208888888892 | 0.052571 | -0.0446 | 0.964623 | 0.482312 |
| M9 | -0.000393133333333388 | 0.052584 | -0.0075 | 0.994061 | 0.497031 |
| M10 | 0.0154754222222222 | 0.054907 | 0.2818 | 0.7791 | 0.38955 |
| M11 | 0.00866771111111108 | 0.0549 | 0.1579 | 0.875117 | 0.437559 |
| t | -0.00163228888888889 | 0.000528 | -3.09 | 0.003115 | 0.001557 |
| Multiple Linear Regression - Regression Statistics | |
| Multiple R | 0.405354443207563 |
| R-squared | 0.164312224628114 |
| Adjusted R-squared | -0.0147637272372902 |
| F-TEST (value) | 0.91755605884822 |
| F-TEST (DF numerator) | 12 |
| F-TEST (DF denominator) | 56 |
| p-value | 0.53588203151911 |
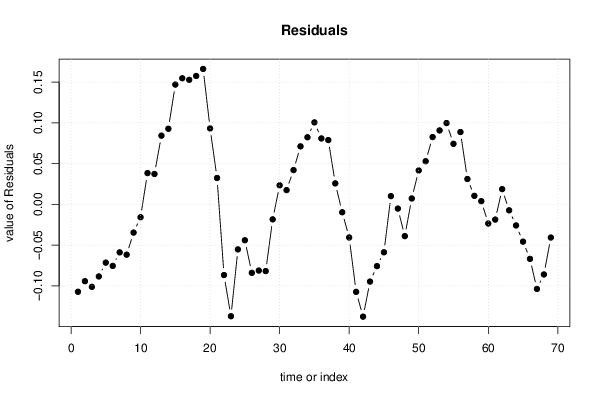
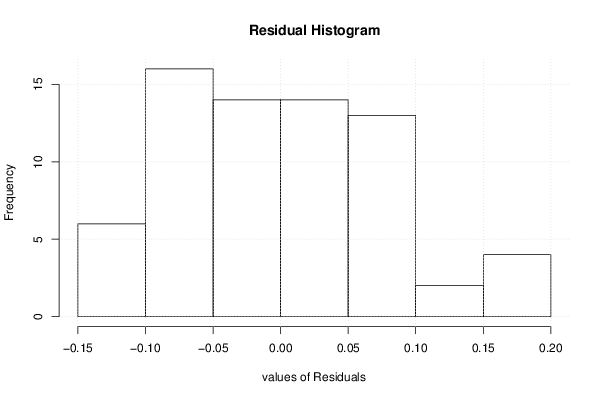
| Multiple Linear Regression - Residual Statistics | |
| Residual Standard Deviation | 0.0867999723173096 |
| Sum Squared Residuals | 0.42191717088 |
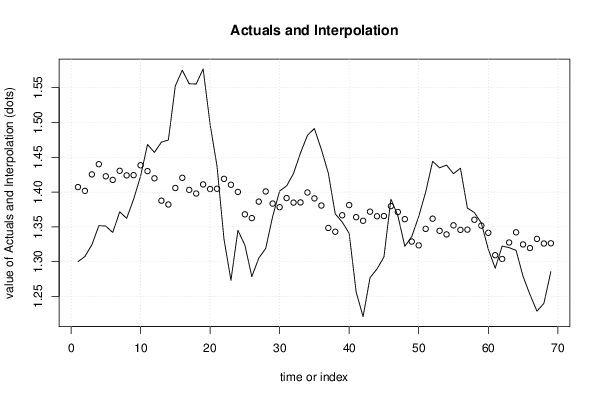
| Multiple Linear Regression - Actuals, Interpolation, and Residuals | |||
| Time or Index | Actuals | Interpolation Forecast | Residuals Prediction Error |
| 1 | 1.2999 | 1.40718533333333 | -0.107285333333333 |
| 2 | 1.3074 | 1.40173533333333 | -0.0943353333333334 |
| 3 | 1.3242 | 1.42543533333333 | -0.101235333333333 |
| 4 | 1.3516 | 1.44008533333333 | -0.0884853333333334 |
| 5 | 1.3511 | 1.422652 | -0.071552 |
| 6 | 1.3419 | 1.41748533333333 | -0.0755853333333332 |
| 7 | 1.3716 | 1.43056866666667 | -0.0589686666666667 |
| 8 | 1.3622 | 1.424002 | -0.061802 |
| 9 | 1.3896 | 1.42431866666667 | -0.0347186666666667 |
| 10 | 1.4227 | 1.43855493333333 | -0.0158549333333333 |
| 11 | 1.4684 | 1.43011493333333 | 0.0382850666666665 |
| 12 | 1.457 | 1.41981493333333 | 0.0371850666666667 |
| 13 | 1.4718 | 1.38759786666667 | 0.0842021333333332 |
| 14 | 1.4748 | 1.38214786666667 | 0.0926521333333334 |
| 15 | 1.5527 | 1.40584786666667 | 0.146852133333333 |
| 16 | 1.5751 | 1.42049786666667 | 0.154602133333333 |
| 17 | 1.5557 | 1.40306453333333 | 0.152635466666667 |
| 18 | 1.5553 | 1.39789786666667 | 0.157402133333333 |
| 19 | 1.577 | 1.4109812 | 0.1660188 |
| 20 | 1.4975 | 1.40441453333333 | 0.0930854666666667 |
| 21 | 1.437 | 1.4047312 | 0.0322688 |
| 22 | 1.3322 | 1.41896746666667 | -0.0867674666666666 |
| 23 | 1.2732 | 1.41052746666667 | -0.137327466666667 |
| 24 | 1.3449 | 1.40022746666667 | -0.0553274666666667 |
| 25 | 1.3239 | 1.3680104 | -0.0441104 |
| 26 | 1.2785 | 1.3625604 | -0.0840604 |
| 27 | 1.305 | 1.3862604 | -0.0812604000000001 |
| 28 | 1.319 | 1.4009104 | -0.0819104 |
| 29 | 1.365 | 1.38347706666667 | -0.0184770666666667 |
| 30 | 1.4016 | 1.3783104 | 0.0232896 |
| 31 | 1.4088 | 1.39139373333333 | 0.0174062666666668 |
| 32 | 1.4268 | 1.38482706666667 | 0.0419729333333334 |
| 33 | 1.4562 | 1.38514373333333 | 0.0710562666666666 |
| 34 | 1.4816 | 1.39938 | 0.08222 |
| 35 | 1.4914 | 1.39094 | 0.10046 |
| 36 | 1.4614 | 1.38064 | 0.08076 |
| 37 | 1.4272 | 1.34842293333333 | 0.0787770666666666 |
| 38 | 1.3686 | 1.34297293333333 | 0.0256270666666667 |
| 39 | 1.3569 | 1.36667293333333 | -0.00977293333333332 |
| 40 | 1.3406 | 1.38132293333333 | -0.0407229333333333 |
| 41 | 1.2565 | 1.3638896 | -0.1073896 |
| 42 | 1.2209 | 1.35872293333333 | -0.137822933333333 |
| 43 | 1.277 | 1.37180626666667 | -0.0948062666666667 |
| 44 | 1.2894 | 1.3652396 | -0.0758395999999999 |
| 45 | 1.3067 | 1.36555626666667 | -0.0588562666666667 |
| 46 | 1.3898 | 1.37979253333333 | 0.0100074666666666 |
| 47 | 1.3661 | 1.37135253333333 | -0.00525253333333325 |
| 48 | 1.322 | 1.36105253333333 | -0.0390525333333333 |
| 49 | 1.336 | 1.32883546666667 | 0.00716453333333332 |
| 50 | 1.3649 | 1.32338546666667 | 0.0415145333333333 |
| 51 | 1.3999 | 1.34708546666667 | 0.0528145333333333 |
| 52 | 1.4442 | 1.36173546666667 | 0.0824645333333333 |
| 53 | 1.4349 | 1.34430213333333 | 0.0905978666666667 |
| 54 | 1.4388 | 1.33913546666667 | 0.0996645333333334 |
| 55 | 1.4264 | 1.3522188 | 0.0741812 |
| 56 | 1.4343 | 1.34565213333333 | 0.0886478666666665 |
| 57 | 1.377 | 1.3459688 | 0.0310312 |
| 58 | 1.3706 | 1.36020506666667 | 0.0103949333333333 |
| 59 | 1.3556 | 1.35176506666667 | 0.00383493333333325 |
| 60 | 1.3179 | 1.34146506666667 | -0.0235650666666666 |
| 61 | 1.2905 | 1.309248 | -0.0187480000000001 |
| 62 | 1.3224 | 1.303798 | 0.018602 |
| 63 | 1.3201 | 1.327498 | -0.0073979999999999 |
| 64 | 1.3162 | 1.342148 | -0.0259479999999999 |
| 65 | 1.2789 | 1.32471466666667 | -0.0458146666666667 |
| 66 | 1.2526 | 1.319548 | -0.066948 |
| 67 | 1.2288 | 1.33263133333333 | -0.103831333333333 |
| 68 | 1.24 | 1.32606466666667 | -0.0860646666666667 |
| 69 | 1.2856 | 1.32638133333333 | -0.0407813333333332 |
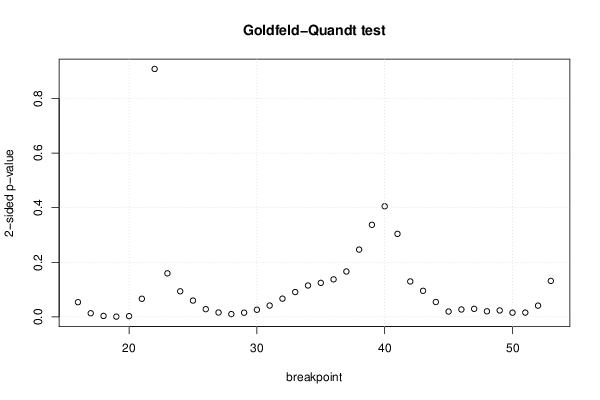
| Goldfeld-Quandt test for Heteroskedasticity | |||
| p-values | Alternative Hypothesis | ||
| breakpoint index | greater | 2-sided | less |
| 16 | 0.0270476713520187 | 0.0540953427040374 | 0.972952328647981 |
| 17 | 0.0068142079239715 | 0.013628415847943 | 0.993185792076029 |
| 18 | 0.00191092883843576 | 0.00382185767687152 | 0.998089071161564 |
| 19 | 0.000550211065640462 | 0.00110042213128092 | 0.99944978893436 |
| 20 | 0.00153226115803993 | 0.00306452231607987 | 0.99846773884196 |
| 21 | 0.0333109913140776 | 0.0666219826281553 | 0.966689008685922 |
| 22 | 0.454185736282388 | 0.908371472564775 | 0.545814263717612 |
| 23 | 0.920106296061017 | 0.159787407877966 | 0.0798937039389831 |
| 24 | 0.952982913789881 | 0.0940341724202383 | 0.0470170862101192 |
| 25 | 0.969963945071143 | 0.0600721098577134 | 0.0300360549288567 |
| 26 | 0.985760773153118 | 0.0284784536937637 | 0.0142392268468818 |
| 27 | 0.99182121534551 | 0.0163575693089795 | 0.00817878465448975 |
| 28 | 0.994770254926535 | 0.0104594901469291 | 0.00522974507346454 |
| 29 | 0.992218639960404 | 0.0155627200791913 | 0.00778136003959566 |
| 30 | 0.986826846364264 | 0.0263463072714712 | 0.0131731536357356 |
| 31 | 0.979080719081197 | 0.0418385618376064 | 0.0209192809188032 |
| 32 | 0.96650303085049 | 0.06699393829902 | 0.03349696914951 |
| 33 | 0.954426233749157 | 0.0911475325016852 | 0.0455737662508426 |
| 34 | 0.942428542365982 | 0.115142915268035 | 0.0575714576340177 |
| 35 | 0.93759105140516 | 0.124817897189679 | 0.0624089485948396 |
| 36 | 0.931113158961541 | 0.137773682076917 | 0.0688868410384587 |
| 37 | 0.916733653641324 | 0.166532692717353 | 0.0832663463586763 |
| 38 | 0.876648033328607 | 0.246703933342786 | 0.123351966671393 |
| 39 | 0.831245804265585 | 0.33750839146883 | 0.168754195734415 |
| 40 | 0.797311652997907 | 0.405376694004185 | 0.202688347002093 |
| 41 | 0.847840703498369 | 0.304318593003263 | 0.152159296501631 |
| 42 | 0.934985109153201 | 0.130029781693599 | 0.0650148908467993 |
| 43 | 0.952151322175602 | 0.0956973556487958 | 0.0478486778243979 |
| 44 | 0.972633365013104 | 0.0547332699737919 | 0.027366634986896 |
| 45 | 0.99005411424646 | 0.0198917715070803 | 0.00994588575354017 |
| 46 | 0.986304788601096 | 0.0273904227978087 | 0.0136952113989043 |
| 47 | 0.985116322436757 | 0.0297673551264865 | 0.0148836775632433 |
| 48 | 0.98958984449455 | 0.0208203110109007 | 0.0104101555054504 |
| 49 | 0.98808494735346 | 0.0238301052930791 | 0.0119150526465396 |
| 50 | 0.992197873943852 | 0.0156042521122964 | 0.00780212605614819 |
| 51 | 0.992015988036447 | 0.0159680239271066 | 0.00798401196355332 |
| 52 | 0.979309565817427 | 0.0413808683651461 | 0.020690434182573 |
| 53 | 0.934035553531772 | 0.131928892936456 | 0.0659644464682281 |
| Meta Analysis of Goldfeld-Quandt test for Heteroskedasticity | |||
| Description | # significant tests | % significant tests | OK/NOK |
| 1% type I error level | 3 | 0.0789473684210526 | NOK |
| 5% type I error level | 18 | 0.473684210526316 | NOK |
| 10% type I error level | 26 | 0.684210526315789 | NOK |