| Multiple Linear Regression - Estimated Regression Equation |
| Werkloosheidsgraad[t] = + 1092.38211650939 -0.00473234036368295Maand[t] + 0.312003440647315`Dollar/euro`[t] -310.150910519746`Pond/euro`[t] -2.11969672123574`Yen/euro\r`[t] + e[t] |
| Multiple Linear Regression - Ordinary Least Squares | |||||
| Variable | Parameter | S.D. | T-STAT H0: parameter = 0 | 2-tail p-value | 1-tail p-value |
| (Intercept) | 1092.38211650939 | 158.706392 | 6.883 | 0 | 0 |
| Maand | -0.00473234036368295 | 0.656424 | -0.0072 | 0.994273 | 0.497137 |
| `Dollar/euro` | 0.312003440647315 | 0.883848 | 0.353 | 0.725409 | 0.362705 |
| `Pond/euro` | -310.150910519746 | 150.370661 | -2.0626 | 0.043803 | 0.021901 |
| `Yen/euro\r` | -2.11969672123574 | 0.484441 | -4.3755 | 5.3e-05 | 2.7e-05 |
| Multiple Linear Regression - Regression Statistics | |
| Multiple R | 0.707216183548097 |
| R-squared | 0.500154730272335 |
| Adjusted R-squared | 0.464451496720359 |
| F-TEST (value) | 14.008667577524 |
| F-TEST (DF numerator) | 4 |
| F-TEST (DF denominator) | 56 |
| p-value | 5.54131834862304e-08 |
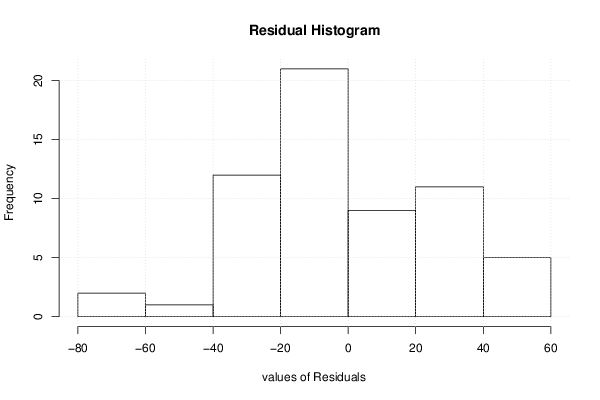
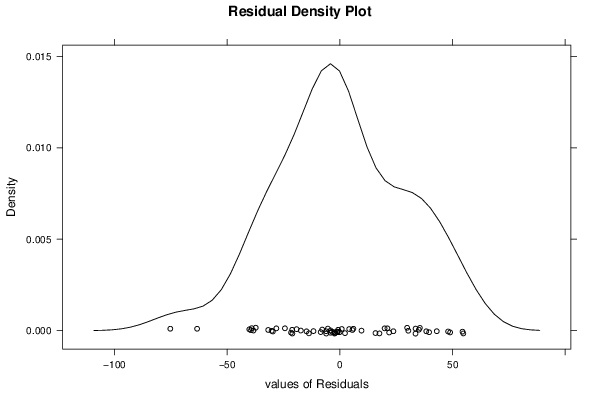
| Multiple Linear Regression - Residual Statistics | |
| Residual Standard Deviation | 29.5898986543267 |
| Sum Squared Residuals | 49031.4777329061 |
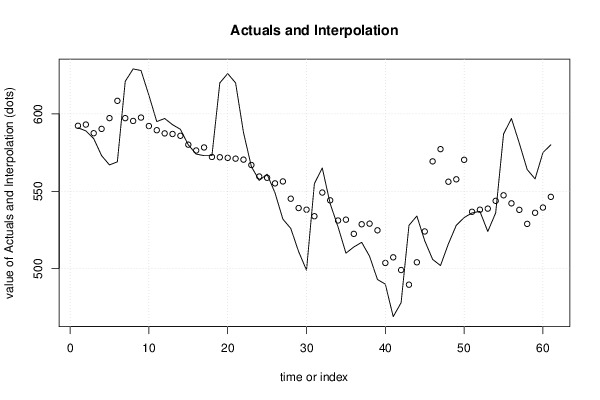
| Multiple Linear Regression - Actuals, Interpolation, and Residuals | |||
| Time or Index | Actuals | Interpolation Forecast | Residuals Prediction Error |
| 1 | 591 | 592.28295435284 | -1.28295435283961 |
| 2 | 589 | 593.083597353243 | -4.08359735324344 |
| 3 | 584 | 587.482401218986 | -3.48240121898599 |
| 4 | 573 | 590.289833565405 | -17.2898335654053 |
| 5 | 567 | 597.235560043061 | -30.2355600430608 |
| 6 | 569 | 608.407492248704 | -39.4074922487042 |
| 7 | 621 | 597.228082318439 | 23.7719176815612 |
| 8 | 629 | 595.40592947341 | 33.5940705265895 |
| 9 | 628 | 597.599246755171 | 30.4007532448289 |
| 10 | 612 | 592.131856177693 | 19.8681438223072 |
| 11 | 595 | 589.424049956178 | 5.57595004382186 |
| 12 | 597 | 587.376774702794 | 9.62322529720648 |
| 13 | 593 | 586.984653532508 | 6.01534646749221 |
| 14 | 590 | 585.827086012715 | 4.17291398728456 |
| 15 | 580 | 580.091179547411 | -0.0911795474114046 |
| 16 | 574 | 576.327614107179 | -2.32761410717862 |
| 17 | 573 | 578.293255838427 | -5.29325583842691 |
| 18 | 573 | 572.134203299251 | 0.86579670074908 |
| 19 | 620 | 571.962145404671 | 48.0378545953287 |
| 20 | 626 | 571.569972135493 | 54.4300278645069 |
| 21 | 620 | 571.054009452968 | 48.9459905470322 |
| 22 | 588 | 570.411172717509 | 17.5888272824908 |
| 23 | 566 | 566.952408291073 | -0.952408291072893 |
| 24 | 557 | 559.531453767896 | -2.53145376789648 |
| 25 | 561 | 558.702606500696 | 2.29739349930435 |
| 26 | 549 | 555.09319714901 | -6.09319714900974 |
| 27 | 532 | 556.356423031345 | -24.356423031345 |
| 28 | 526 | 545.175860762349 | -19.1758607623485 |
| 29 | 511 | 539.159033893593 | -28.1590338935929 |
| 30 | 499 | 538.086666823829 | -39.0866668238295 |
| 31 | 555 | 533.868453862241 | 21.1315461377588 |
| 32 | 565 | 549.16616295089 | 15.8338370491102 |
| 33 | 542 | 544.137961370986 | -2.13796137098564 |
| 34 | 527 | 531.107660870058 | -4.10766087005834 |
| 35 | 510 | 531.635954674953 | -21.6359546749529 |
| 36 | 514 | 522.482790354261 | -8.48279035426098 |
| 37 | 517 | 528.685342943809 | -11.6853429438089 |
| 38 | 508 | 529.050498518924 | -21.0504985189242 |
| 39 | 493 | 524.770376481656 | -31.7703764816562 |
| 40 | 490 | 503.696371786181 | -13.696371786181 |
| 41 | 469 | 507.326518543266 | -38.3265185432662 |
| 42 | 478 | 499.124522159255 | -21.124522159255 |
| 43 | 528 | 489.633258492487 | 38.3667415075126 |
| 44 | 534 | 504.115630210323 | 29.8843697896766 |
| 45 | 518 | 524.029787214564 | -6.02978721456386 |
| 46 | 506 | 569.30951418189 | -63.3095141818897 |
| 47 | 502 | 577.195261719655 | -75.1952617196553 |
| 48 | 516 | 556.141757579704 | -40.141757579704 |
| 49 | 528 | 557.712092418614 | -29.712092418614 |
| 50 | 533 | 570.298397308621 | -37.2983973086212 |
| 51 | 536 | 536.735258806551 | -0.735258806550476 |
| 52 | 537 | 538.078018161629 | -1.07801816162933 |
| 53 | 524 | 538.765303171577 | -14.7653031715773 |
| 54 | 536 | 543.807586223486 | -7.80758622348609 |
| 55 | 587 | 547.391783747298 | 39.6082162527022 |
| 56 | 597 | 542.200924229908 | 54.7990757700918 |
| 57 | 581 | 537.98633165426 | 43.0136683457403 |
| 58 | 564 | 528.916826659681 | 35.0831733403194 |
| 59 | 558 | 536.099198234616 | 21.9008017653843 |
| 60 | 575 | 539.483410363017 | 35.516589636983 |
| 61 | 580 | 546.386324671791 | 33.6136753282088 |
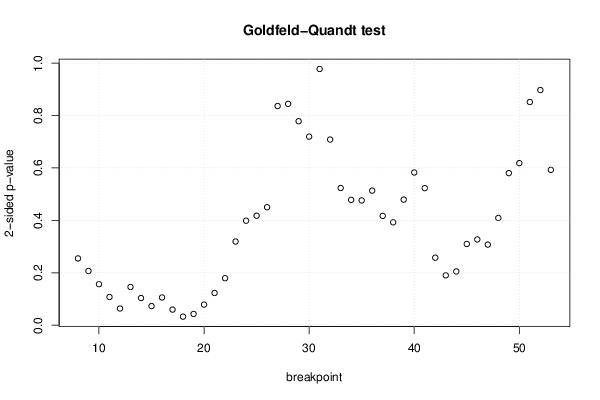
| Goldfeld-Quandt test for Heteroskedasticity | |||
| p-values | Alternative Hypothesis | ||
| breakpoint index | greater | 2-sided | less |
| 8 | 0.127490065036392 | 0.254980130072783 | 0.872509934963608 |
| 9 | 0.103395690862422 | 0.206791381724845 | 0.896604309137578 |
| 10 | 0.0782863833544547 | 0.156572766708909 | 0.921713616645545 |
| 11 | 0.0538034967478878 | 0.107606993495776 | 0.946196503252112 |
| 12 | 0.0318382000345418 | 0.0636764000690837 | 0.968161799965458 |
| 13 | 0.0729302078835133 | 0.145860415767027 | 0.927069792116487 |
| 14 | 0.0518120772049051 | 0.10362415440981 | 0.948187922795095 |
| 15 | 0.0365111331947499 | 0.0730222663894998 | 0.96348886680525 |
| 16 | 0.0529091277798213 | 0.105818255559643 | 0.947090872220179 |
| 17 | 0.0297630947682005 | 0.0595261895364011 | 0.9702369052318 |
| 18 | 0.0162985051809882 | 0.0325970103619763 | 0.983701494819012 |
| 19 | 0.0214120654955175 | 0.0428241309910351 | 0.978587934504482 |
| 20 | 0.039281993262381 | 0.078563986524762 | 0.960718006737619 |
| 21 | 0.0614642448469122 | 0.122928489693824 | 0.938535755153088 |
| 22 | 0.0896669536579729 | 0.179333907315946 | 0.910333046342027 |
| 23 | 0.159637839090491 | 0.319275678180982 | 0.840362160909509 |
| 24 | 0.199403449955871 | 0.398806899911743 | 0.800596550044129 |
| 25 | 0.20888739870989 | 0.41777479741978 | 0.79111260129011 |
| 26 | 0.225110441849174 | 0.450220883698349 | 0.774889558150826 |
| 27 | 0.418225851608415 | 0.836451703216829 | 0.581774148391585 |
| 28 | 0.422424154261124 | 0.844848308522248 | 0.577575845738876 |
| 29 | 0.38925114142429 | 0.77850228284858 | 0.61074885857571 |
| 30 | 0.359827104595523 | 0.719654209191046 | 0.640172895404477 |
| 31 | 0.510979960642803 | 0.978040078714395 | 0.489020039357197 |
| 32 | 0.645726037183772 | 0.708547925632456 | 0.354273962816228 |
| 33 | 0.738108280918288 | 0.523783438163424 | 0.261891719081712 |
| 34 | 0.760893388816313 | 0.478213222367374 | 0.239106611183687 |
| 35 | 0.761862959322277 | 0.476274081355446 | 0.238137040677723 |
| 36 | 0.743164980030442 | 0.513670039939115 | 0.256835019969558 |
| 37 | 0.79141330061732 | 0.417173398765361 | 0.208586699382681 |
| 38 | 0.803633230393145 | 0.392733539213709 | 0.196366769606854 |
| 39 | 0.760333084638684 | 0.479333830722633 | 0.239666915361316 |
| 40 | 0.708592887107644 | 0.582814225784711 | 0.291407112892356 |
| 41 | 0.738508376798081 | 0.522983246403838 | 0.261491623201919 |
| 42 | 0.871196945928905 | 0.257606108142191 | 0.128803054071095 |
| 43 | 0.904850747333064 | 0.190298505333872 | 0.0951492526669361 |
| 44 | 0.897442213952 | 0.205115572095999 | 0.102557786048 |
| 45 | 0.844977332608426 | 0.310045334783148 | 0.155022667391574 |
| 46 | 0.836368804500713 | 0.327262390998573 | 0.163631195499287 |
| 47 | 0.846166349887674 | 0.307667300224651 | 0.153833650112326 |
| 48 | 0.795378343427447 | 0.409243313145105 | 0.204621656572553 |
| 49 | 0.70980535438501 | 0.58038929122998 | 0.29019464561499 |
| 50 | 0.690761991087903 | 0.618476017824195 | 0.309238008912097 |
| 51 | 0.574037224109011 | 0.851925551781977 | 0.425962775890988 |
| 52 | 0.448729611349946 | 0.897459222699893 | 0.551270388650054 |
| 53 | 0.296371750803887 | 0.592743501607774 | 0.703628249196113 |
| Meta Analysis of Goldfeld-Quandt test for Heteroskedasticity | |||
| Description | # significant tests | % significant tests | OK/NOK |
| 1% type I error level | 0 | 0 | OK |
| 5% type I error level | 2 | 0.0434782608695652 | OK |
| 10% type I error level | 6 | 0.130434782608696 | NOK |