| Multiple Linear Regression - Estimated Regression Equation |
| wn[t] = -0.482589666805368 -0.0019639816208048ta[t] + 0.000918919891368292omzet[t] + 0.0155105975931151mw[t] -0.0940278026115134winst[t] + 0.024674319298947cf[t] + 4.03359881439576dienst[t] -2.56006294870041product[t] + 0.000568604447350252ta_d[t] + 0.00917513969824316omzet_d[t] -0.0112623094879224mw_d[t] + 0.253854810908797winst_d[t] -0.104044736313532cf_d[t] -0.00116508725179709ta_p[t] + 0.0146516776327829omzet_p[t] -0.0215121429961511mw_p[t] + 0.113719105649213cf_p[t] + e[t] |
| Multiple Linear Regression - Ordinary Least Squares | |||||
| Variable | Parameter | S.D. | T-STAT H0: parameter = 0 | 2-tail p-value | 1-tail p-value |
| (Intercept) | -0.482589666805368 | 4.785358 | -0.1008 | 0.919997 | 0.459999 |
| ta | -0.0019639816208048 | 0.002703 | -0.7267 | 0.47014 | 0.23507 |
| omzet | 0.000918919891368292 | 0.00266 | 0.3454 | 0.73095 | 0.365475 |
| mw | 0.0155105975931151 | 0.004418 | 3.5105 | 0.00084 | 0.00042 |
| winst | -0.0940278026115134 | 0.053701 | -1.751 | 0.084899 | 0.042449 |
| cf | 0.024674319298947 | 0.041404 | 0.5959 | 0.553389 | 0.276695 |
| dienst | 4.03359881439576 | 5.65031 | 0.7139 | 0.477985 | 0.238993 |
| product | -2.56006294870041 | 6.747182 | -0.3794 | 0.705667 | 0.352834 |
| ta_d | 0.000568604447350252 | 0.00272 | 0.2091 | 0.835073 | 0.417537 |
| omzet_d | 0.00917513969824316 | 0.002773 | 3.3084 | 0.001566 | 0.000783 |
| mw_d | -0.0112623094879224 | 0.005497 | -2.0487 | 0.04473 | 0.022365 |
| winst_d | 0.253854810908797 | 0.062939 | 4.0334 | 0.000153 | 7.7e-05 |
| cf_d | -0.104044736313532 | 0.047296 | -2.1999 | 0.031554 | 0.015777 |
| ta_p | -0.00116508725179709 | 0.003447 | -0.338 | 0.73653 | 0.368265 |
| omzet_p | 0.0146516776327829 | 0.002974 | 4.9263 | 7e-06 | 3e-06 |
| mw_p | -0.0215121429961511 | 0.005409 | -3.9769 | 0.000185 | 9.3e-05 |
| cf_p | 0.113719105649213 | 0.032576 | 3.4908 | 0.000893 | 0.000446 |
| Multiple Linear Regression - Regression Statistics | |
| Multiple R | 0.983587811537261 |
| R-squared | 0.967444983004658 |
| Adjusted R-squared | 0.959043688296182 |
| F-TEST (value) | 115.154272832338 |
| F-TEST (DF numerator) | 16 |
| F-TEST (DF denominator) | 62 |
| p-value | 0 |
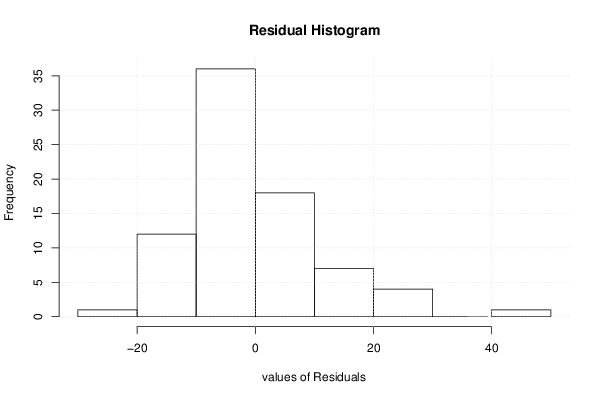
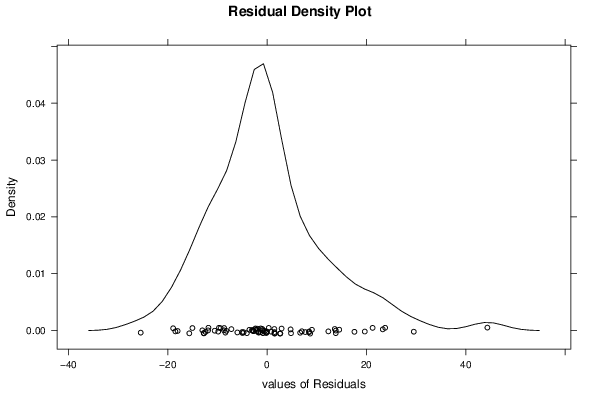
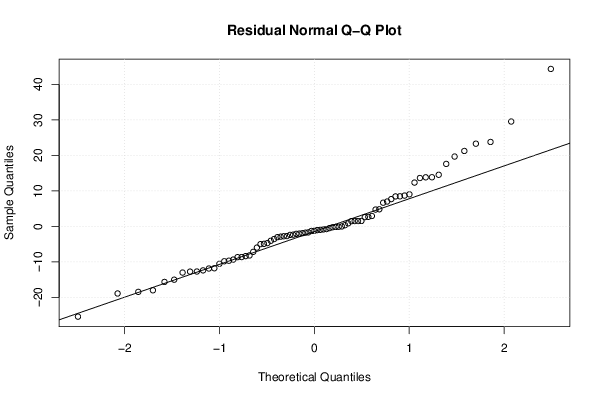
| Multiple Linear Regression - Residual Statistics | |
| Residual Standard Deviation | 13.0541447793876 |
| Sum Squared Residuals | 10565.4631471151 |
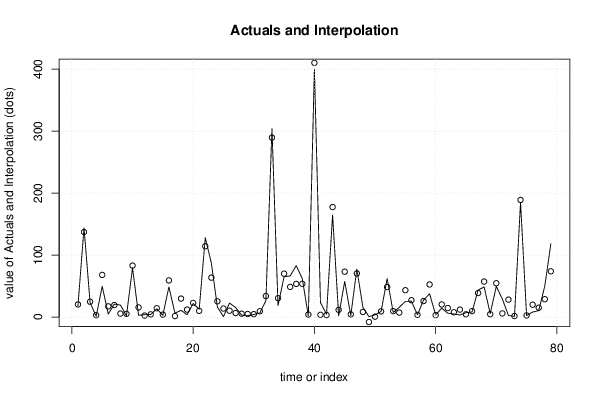
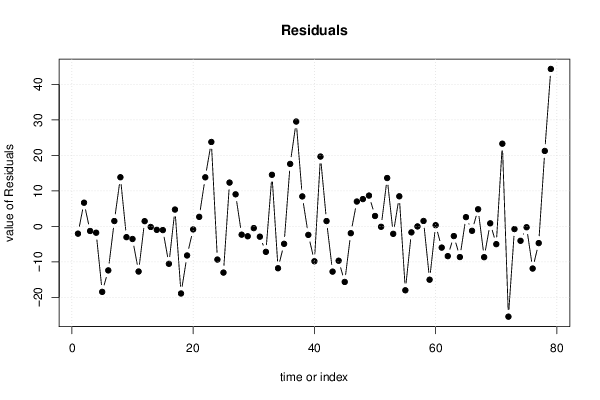
| Multiple Linear Regression - Actuals, Interpolation, and Residuals | |||
| Time or Index | Actuals | Interpolation Forecast | Residuals Prediction Error |
| 1 | 18.2 | 20.26404578253 | -2.06404578253 |
| 2 | 143.8 | 137.142884771354 | 6.65711522864641 |
| 3 | 23.4 | 24.7116538565276 | -1.31165385652759 |
| 4 | 1.1 | 2.89603040001339 | -1.79603040001339 |
| 5 | 49.5 | 67.9700692903106 | -18.4700692903106 |
| 6 | 4.8 | 17.2145048268355 | -12.4145048268355 |
| 7 | 20.8 | 19.3044327697223 | 1.49556723027767 |
| 8 | 19.4 | 5.56445902275015 | 13.8355409772499 |
| 9 | 2.1 | 5.14979696402705 | -3.04979696402705 |
| 10 | 79.4 | 82.9717620430496 | -3.57176204304957 |
| 11 | 2.8 | 15.5320953176455 | -12.7320953176455 |
| 12 | 3.8 | 2.34072262331106 | 1.45927737668894 |
| 13 | 4.1 | 4.27884690996464 | -0.178846909964642 |
| 14 | 13.2 | 14.185432102017 | -0.985432102017027 |
| 15 | 2.8 | 3.85306121468615 | -1.05306121468615 |
| 16 | 48.5 | 59.0564749163737 | -10.5564749163737 |
| 17 | 6.2 | 1.47370868986224 | 4.72629131013776 |
| 18 | 10.8 | 29.7226312212085 | -18.9226312212085 |
| 19 | 3.8 | 12.0082101754515 | -8.20821017545145 |
| 20 | 21.9 | 22.7617239661268 | -0.861723966126757 |
| 21 | 12.6 | 9.93066325579593 | 2.66933674420407 |
| 22 | 128 | 114.180759613727 | 13.8192403862728 |
| 23 | 87.3 | 63.5244431964436 | 23.7755568035564 |
| 24 | 16 | 25.3678286439466 | -9.36782864394663 |
| 25 | 0.7 | 13.7354295863332 | -13.0354295863332 |
| 26 | 22.5 | 10.1680203490627 | 12.3319796509373 |
| 27 | 15.4 | 6.37444370147195 | 9.02555629852805 |
| 28 | 3 | 5.34568489161739 | -2.34568489161739 |
| 29 | 2.1 | 4.89801464674306 | -2.79801464674306 |
| 30 | 4.1 | 4.59699492966701 | -0.496994929667013 |
| 31 | 6.4 | 9.31462589106662 | -2.91462589106662 |
| 32 | 26.6 | 33.7938048771319 | -7.19380487713189 |
| 33 | 304 | 289.469695043902 | 14.530304956098 |
| 34 | 18.6 | 30.4141210432007 | -11.8141210432007 |
| 35 | 65 | 69.9319369626831 | -4.93193696268312 |
| 36 | 66.2 | 48.6116874158603 | 17.5883125841397 |
| 37 | 83 | 53.4667917350617 | 29.5332082649383 |
| 38 | 62 | 53.5682276098399 | 8.43177239016013 |
| 39 | 1.6 | 4.01014670355359 | -2.41014670355359 |
| 40 | 400.2 | 410.044595748462 | -9.84459574846234 |
| 41 | 23.3 | 3.63320462563821 | 19.6667953743618 |
| 42 | 4.6 | 3.11472514990335 | 1.48527485009665 |
| 43 | 164.6 | 177.365482455016 | -12.7654824550164 |
| 44 | 1.9 | 11.5959716091722 | -9.69597160917218 |
| 45 | 57.5 | 73.1681290524712 | -15.6681290524712 |
| 46 | 2.4 | 4.33938797503698 | -1.93938797503698 |
| 47 | 77.3 | 70.312489739374 | 6.98751026062598 |
| 48 | 15.8 | 8.11935607759719 | 7.68064392240282 |
| 49 | 0.6 | -8.06634370891604 | 8.66634370891604 |
| 50 | 3.5 | 0.58395586712068 | 2.91604413287932 |
| 51 | 9 | 9.12255633276976 | -0.122556332769761 |
| 52 | 62 | 48.3807623867181 | 13.6192376132819 |
| 53 | 7.4 | 9.51450669372579 | -2.11450669372579 |
| 54 | 15.6 | 7.13606574514469 | 8.46393425485531 |
| 55 | 25.2 | 43.2235308927727 | -18.0235308927727 |
| 56 | 25.4 | 27.0974797046171 | -1.69747970461711 |
| 57 | 3.5 | 3.52320461160504 | -0.0232046116050384 |
| 58 | 27.3 | 25.7879389853127 | 1.51206101468734 |
| 59 | 37.5 | 52.5385250031436 | -15.0385250031436 |
| 60 | 3.4 | 3.07156603277123 | 0.328433967228775 |
| 61 | 14.3 | 20.2890446520356 | -5.9890446520356 |
| 62 | 6.1 | 14.4975226508702 | -8.39752265087017 |
| 63 | 4.9 | 7.64043155495818 | -2.74043155495818 |
| 64 | 3.3 | 11.9548980636366 | -8.65489806363659 |
| 65 | 7 | 4.40316672599147 | 2.59683327400853 |
| 66 | 8.2 | 9.46268943677432 | -1.26268943677433 |
| 67 | 43.5 | 38.6906726524944 | 4.80932734750565 |
| 68 | 48.5 | 57.1892260418941 | -8.6892260418941 |
| 69 | 5.4 | 4.55595295519355 | 0.844047044806452 |
| 70 | 49.5 | 54.5246150128051 | -5.02461501280509 |
| 71 | 29.1 | 5.81205503920531 | 23.2879449607947 |
| 72 | 2.6 | 28.0529687030544 | -25.4529687030544 |
| 73 | 0.8 | 1.5717019656024 | -0.771701965602397 |
| 74 | 184.8 | 188.872107929342 | -4.072107929342 |
| 75 | 2.3 | 2.55648473254814 | -0.256484732548137 |
| 76 | 8 | 19.8890184314072 | -11.8890184314072 |
| 77 | 10.3 | 15.0205683813587 | -4.72056838135867 |
| 78 | 50 | 28.7581202642141 | 21.2418797357859 |
| 79 | 118.1 | 73.7457968662819 | 44.3542031337181 |
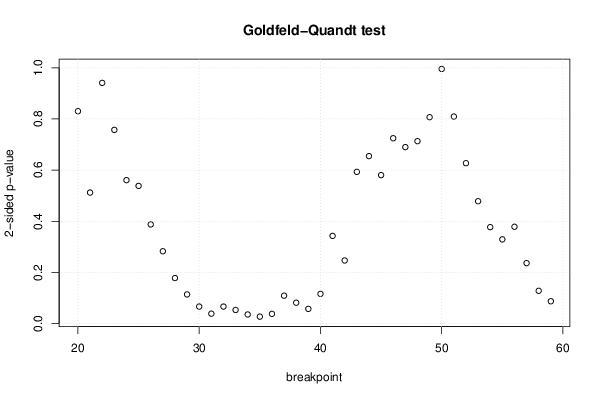
| Goldfeld-Quandt test for Heteroskedasticity | |||
| p-values | Alternative Hypothesis | ||
| breakpoint index | greater | 2-sided | less |
| 20 | 0.415117982932269 | 0.830235965864538 | 0.584882017067731 |
| 21 | 0.256137389034618 | 0.512274778069236 | 0.743862610965382 |
| 22 | 0.470453647180432 | 0.940907294360863 | 0.529546352819569 |
| 23 | 0.378647023027958 | 0.757294046055916 | 0.621352976972042 |
| 24 | 0.280390284966301 | 0.560780569932602 | 0.719609715033699 |
| 25 | 0.269205885318285 | 0.53841177063657 | 0.730794114681715 |
| 26 | 0.19391890709671 | 0.38783781419342 | 0.80608109290329 |
| 27 | 0.141545374988538 | 0.283090749977077 | 0.858454625011462 |
| 28 | 0.0892039316262149 | 0.17840786325243 | 0.910796068373785 |
| 29 | 0.0572004006114962 | 0.114400801222992 | 0.942799599388504 |
| 30 | 0.0334397718224878 | 0.0668795436449756 | 0.966560228177512 |
| 31 | 0.0195962483283351 | 0.0391924966566701 | 0.980403751671665 |
| 32 | 0.0333779888759382 | 0.0667559777518764 | 0.966622011124062 |
| 33 | 0.0268658699794231 | 0.0537317399588462 | 0.973134130020577 |
| 34 | 0.0179965448547633 | 0.0359930897095266 | 0.982003455145237 |
| 35 | 0.0137448568962873 | 0.0274897137925745 | 0.986255143103713 |
| 36 | 0.0191731538253336 | 0.0383463076506672 | 0.980826846174666 |
| 37 | 0.0547376898737502 | 0.1094753797475 | 0.94526231012625 |
| 38 | 0.0409635202384663 | 0.0819270404769326 | 0.959036479761534 |
| 39 | 0.0289085227031531 | 0.0578170454063062 | 0.971091477296847 |
| 40 | 0.0582827761679323 | 0.116565552335865 | 0.941717223832068 |
| 41 | 0.171530379985803 | 0.343060759971606 | 0.828469620014197 |
| 42 | 0.123485676167753 | 0.246971352335506 | 0.876514323832247 |
| 43 | 0.296647725806863 | 0.593295451613726 | 0.703352274193137 |
| 44 | 0.327385468909608 | 0.654770937819217 | 0.672614531090392 |
| 45 | 0.709755230484558 | 0.580489539030884 | 0.290244769515442 |
| 46 | 0.63769971877514 | 0.724600562449721 | 0.36230028122486 |
| 47 | 0.655064697276607 | 0.689870605446785 | 0.344935302723393 |
| 48 | 0.64345282296023 | 0.71309435407954 | 0.35654717703977 |
| 49 | 0.596566573942361 | 0.806866852115277 | 0.403433426057639 |
| 50 | 0.502326732825224 | 0.995346534349552 | 0.497673267174776 |
| 51 | 0.404673419883079 | 0.809346839766157 | 0.595326580116921 |
| 52 | 0.313523911050368 | 0.627047822100735 | 0.686476088949632 |
| 53 | 0.239252572429233 | 0.478505144858466 | 0.760747427570767 |
| 54 | 0.18857190684404 | 0.377143813688079 | 0.81142809315596 |
| 55 | 0.164710871772921 | 0.329421743545843 | 0.835289128227079 |
| 56 | 0.189359005074233 | 0.378718010148466 | 0.810640994925767 |
| 57 | 0.118280069306553 | 0.236560138613105 | 0.881719930693447 |
| 58 | 0.064245841475287 | 0.128491682950574 | 0.935754158524713 |
| 59 | 0.0438244793499637 | 0.0876489586999273 | 0.956175520650036 |
| Meta Analysis of Goldfeld-Quandt test for Heteroskedasticity | |||
| Description | # significant tests | % significant tests | OK/NOK |
| 1% type I error level | 0 | 0 | OK |
| 5% type I error level | 4 | 0.1 | NOK |
| 10% type I error level | 10 | 0.25 | NOK |